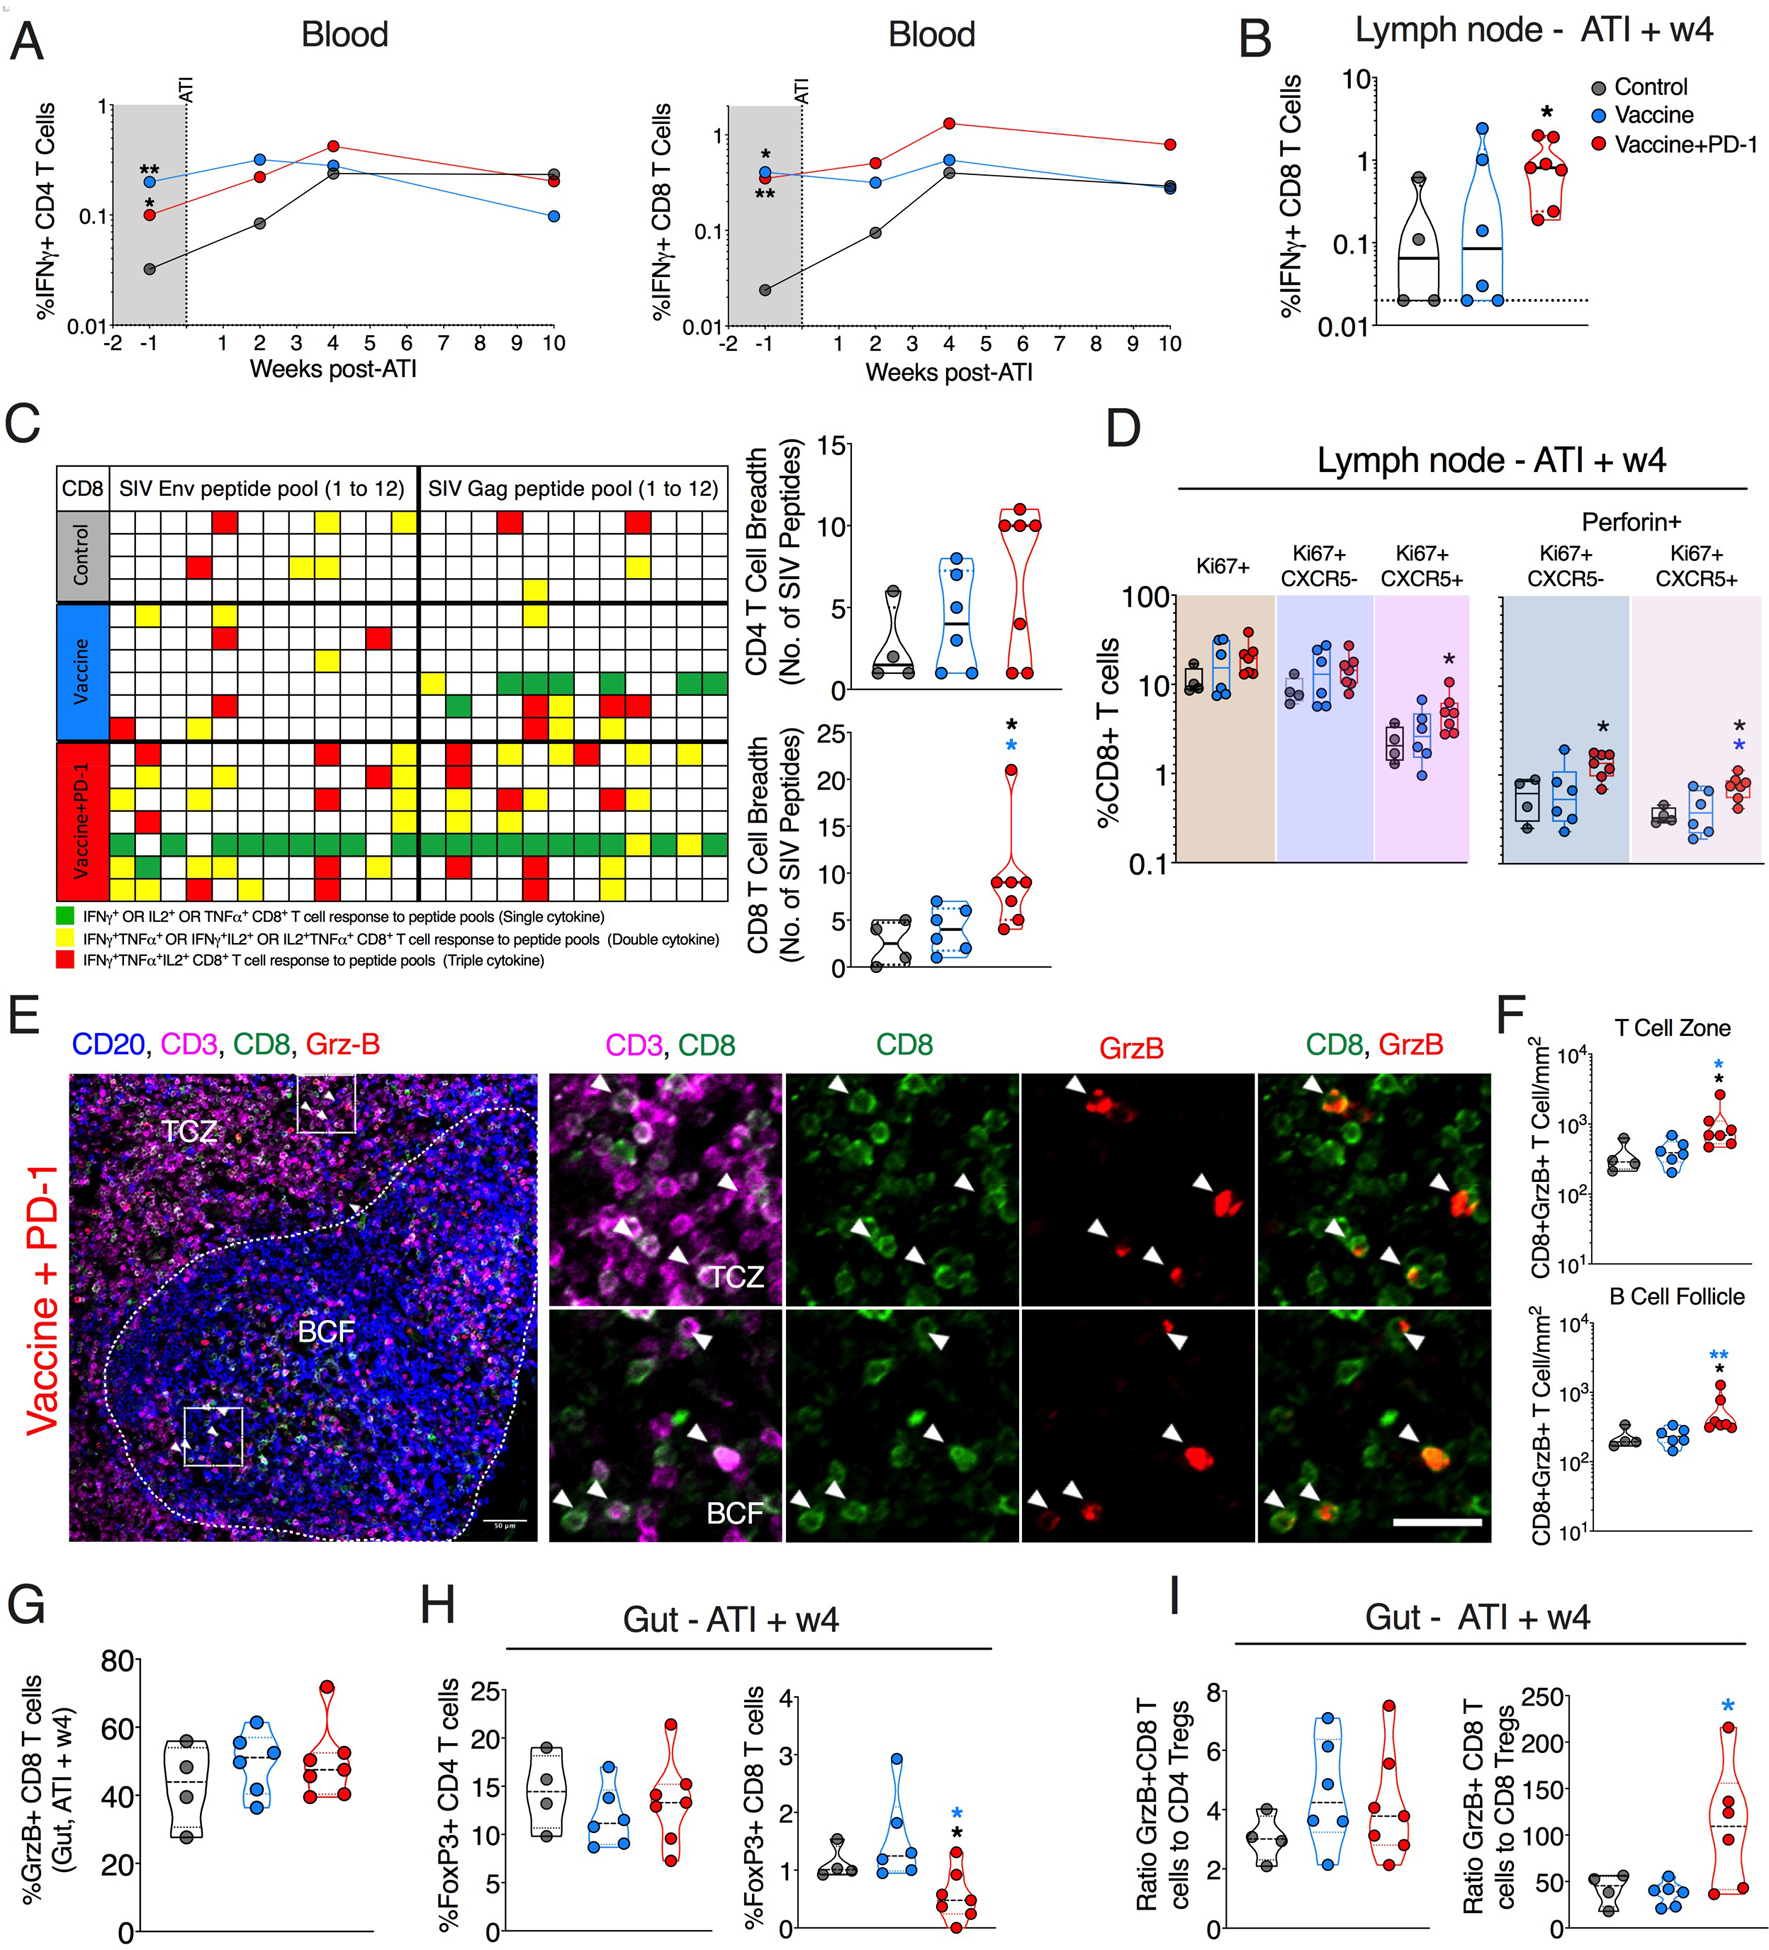
Fig. 5. PD-1 blockade combined with the vaccination preserved CD8+ T cell functional quality and breadth after ATI.

(A) Longitudinal SIV-specific IFNγ+ CD4+ and CD8+ T cells in blood. (B) SIV (Gag + Env)–specific IFNγ+ CD8+ T cell in response in LN. (C) CD8 T cell breadth against SIV Gag and Env peptide pools (grid plot) and the respective quantification for each group is shown on the right. (D) Frequency of total Ki67+, CXCR5− Ki67+, and CXCR5+ Ki67+ CD8+ T cells expressing perforin in LN at 4 weeks after ATI. (E and F) Quantification of total CD8+ T cells coexpressing GrzB using immunohistochemistry. Representative images from ~10 different regions of a LN section per animal (N = 6 for vaccine and ART-only control groups and 7 for vaccine + PD-1 group (E) and summary of data for all animals (F). The inset (white square) shows the representative region picked to show zoomed images on the right. (G) Frequency of GrzB+ CD8 T cells in the gut at 4 weeks after ATI. (H) Frequency of regulatory CD4 and CD8 T cells in the gut at 4 weeks after ATI. (I) The ratio of cytolytic CD8 T cells to regulatory CD4 and CD8 T cells. The color of the significance star denotes the group to which comparison was made. Black/gray, blue, and red color refer to the control, vaccine, and vaccine + PD-1 groups, respectively. P value was calculated using Mann-Whitney test. *P ≤ 0.05; **P < 0.01. Scale bars, 25 μm.
