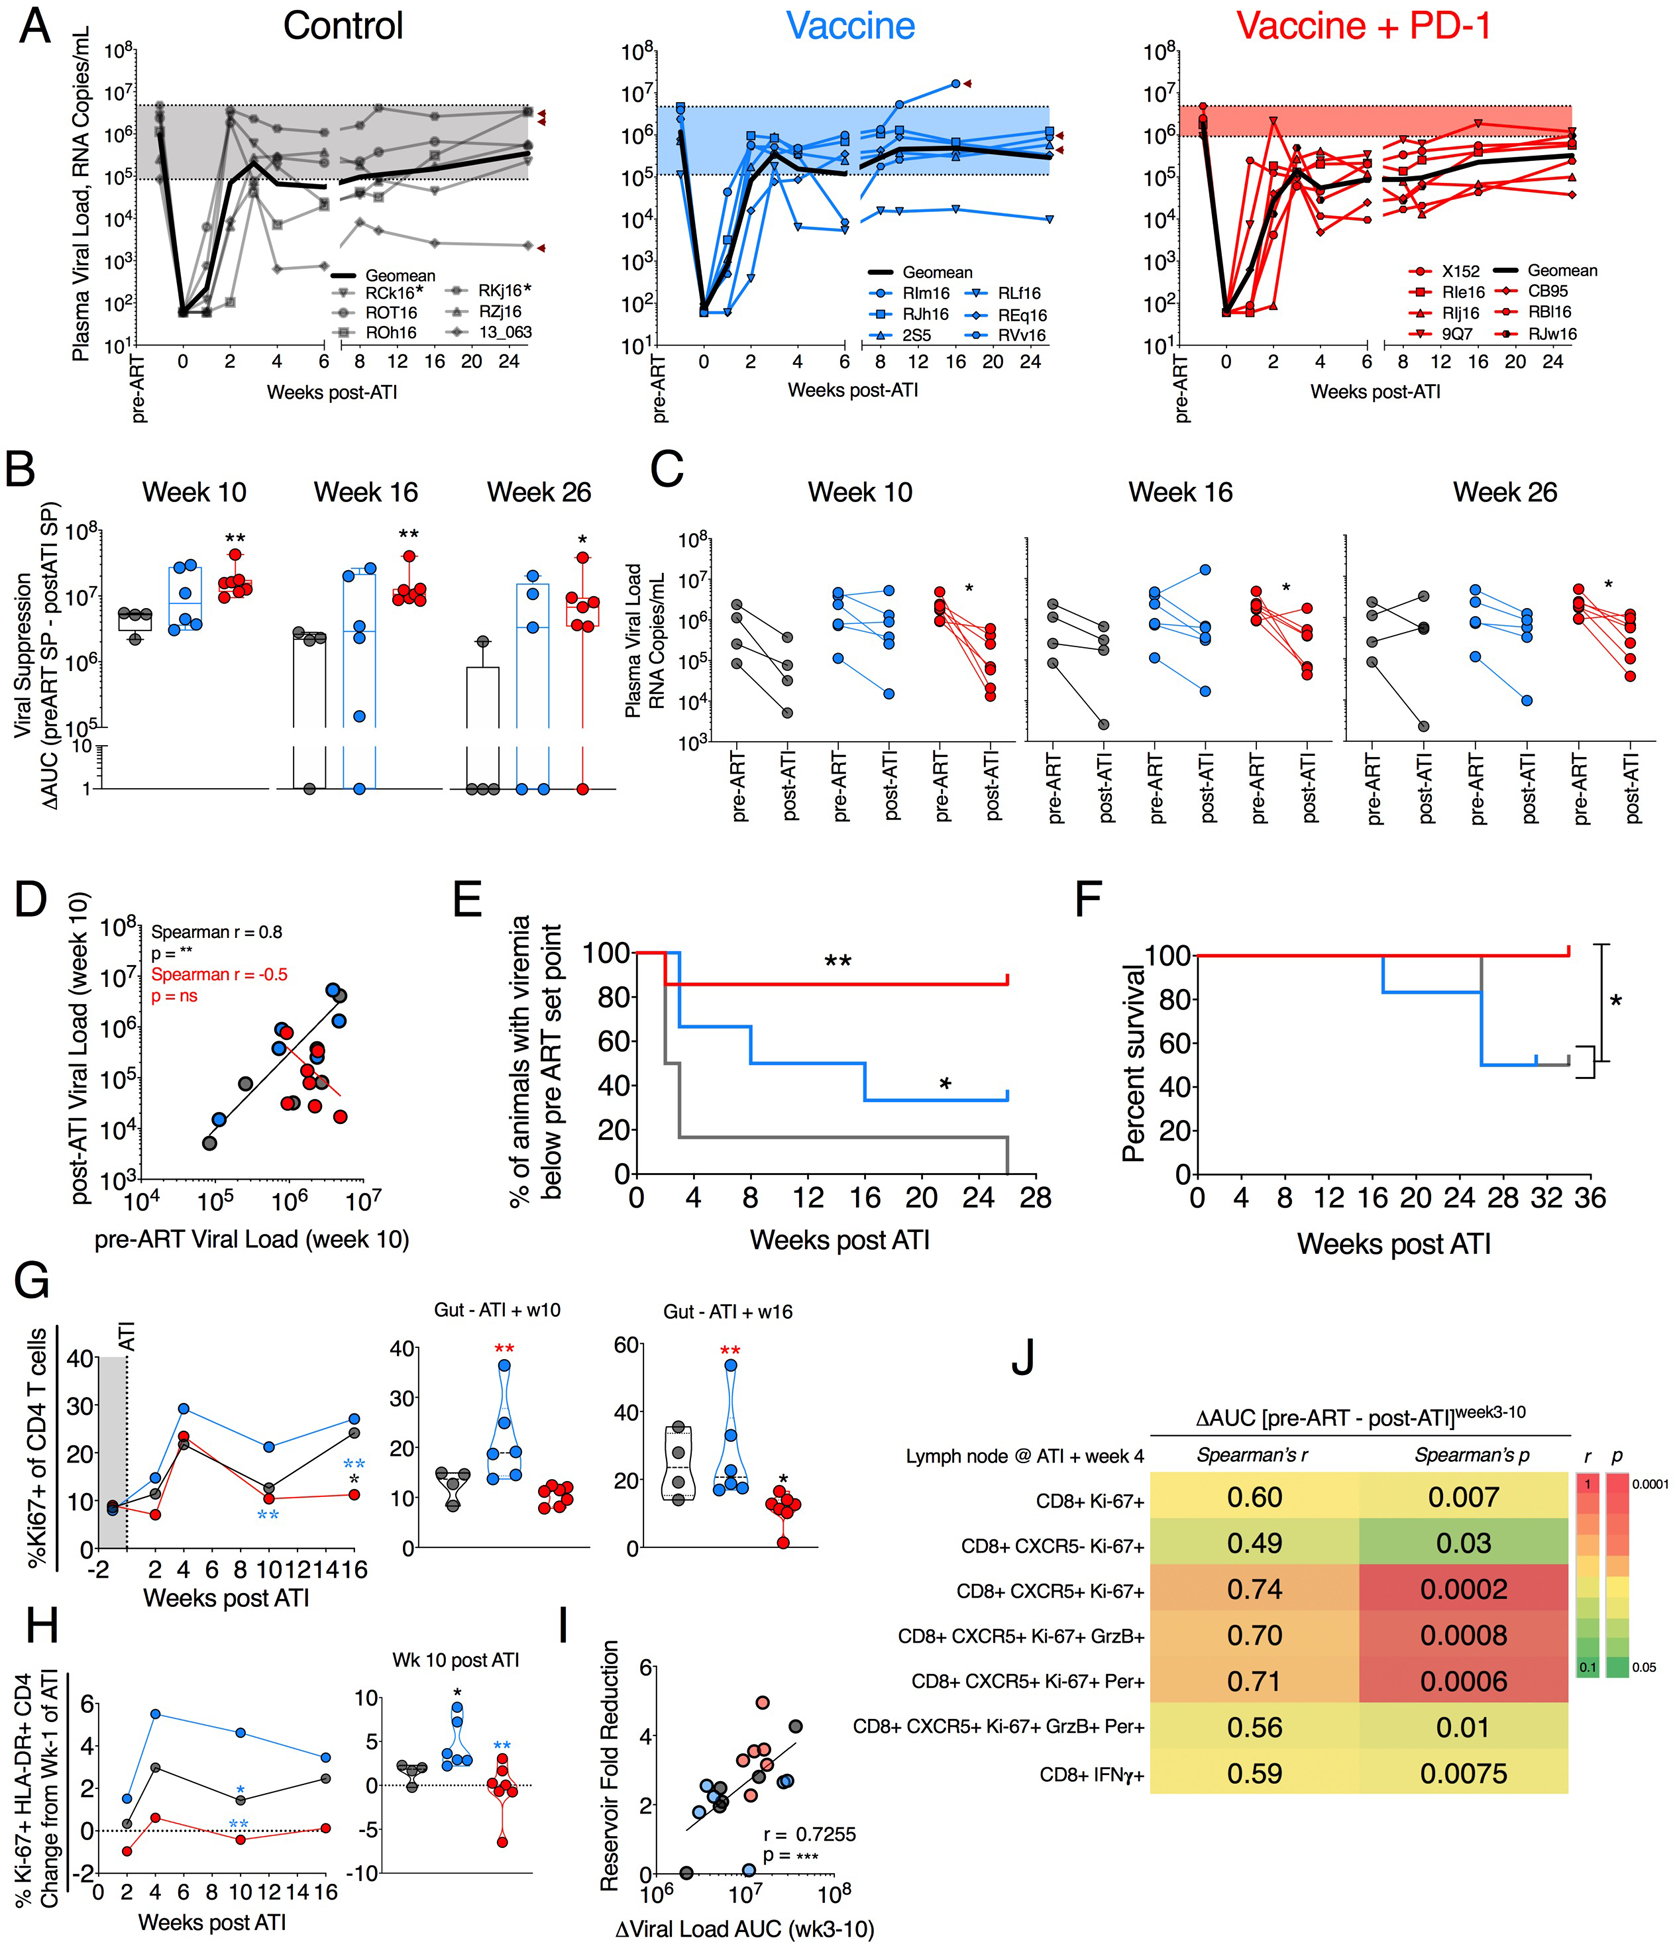
Fig. 6. PD-1 blockade combined with the vaccination significantly suppressed viral rebound after ATI and maintained lower CD4 T cell activation in gut.

(A) Viral rebound after ATI compared with pre-ART set point VL. The arrowheads indicate that animals died because of AIDS-related complications. Animals given MVA at week 60 in error are asterisked. (B) Viral suppression calculated as the difference between AUC of pre-ART (week 3 to week 10) set point viremia and post-ATI (week 3 to indicated week) set point viremia. (C) VL comparison between pre-ART set point and post-ATI viremia at weeks 10, 16, and 26. (D) Correlation of pre-ART VL with post-ATI VL shown at week 10 after ATI. (E) Kaplan-Meier curve showing percentage of animal controlling viremia twofold below pre-ART set point VL. (F) Kaplan-Meier curve showing percent animal survival without AIDS after ATI. (G) Ki67+ CD4 T cells after ATI. (H) Longitudinal change in the frequency of Ki67+ HLA-DR+ CD4 T cells after ATI. (I) Spearman correlation between the fold SIV DNA reservoir reduction (pre- to postvaccination) and the viral suppression (VL AUC differences between pre-ART, weeks 3 to 10, and post-ATI, weeks 3 to 10 VL set points). (J) Spearman correlation between multiple CD8 T cell parameters and viral suppression (AUC differences) between pre-ART (weeks 3 to 10) and post-ATI (weeks 3 to 10) VL set points. For analyses in (A) to (H), P value was calculated using Mann-Whitney test. To adjust for seven multiple comparison in (I), we performed Bonferroni correction. Assuming the overall significance level to be 0.05, the significance threshold for individual correlation is 0.05/7 = 0.007. Under this significance threshold, four of seven are considered significant. The color of the significance star denotes the group to which comparison was made. Black/ gray, blue, and red color refer to the control, vaccine, and vaccine + PD-1 groups, respectively. *P ≤ 0.05; **P < 0.01.
