
Figure 2.
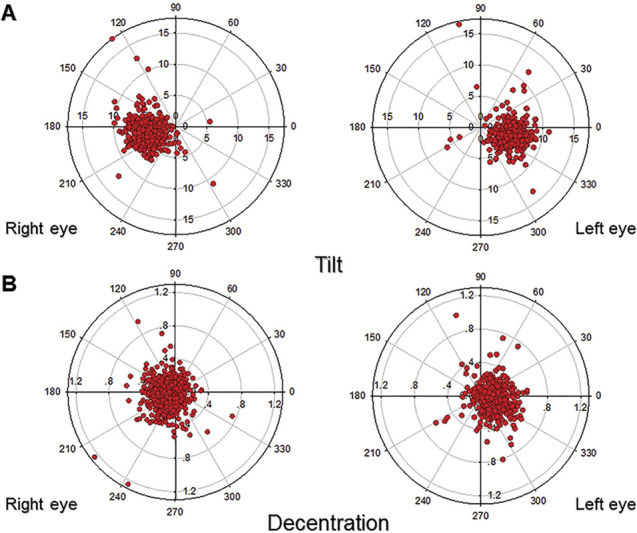
The distributions of tilt and decentration of the crystalline lenses in both eyes. A: Coordinate graphics showing the orientations and values of crystalline lenses tilt in the both eyes. B: Coordinate graphics showing the orientations and values of crystalline lens decentration in the both eyes.