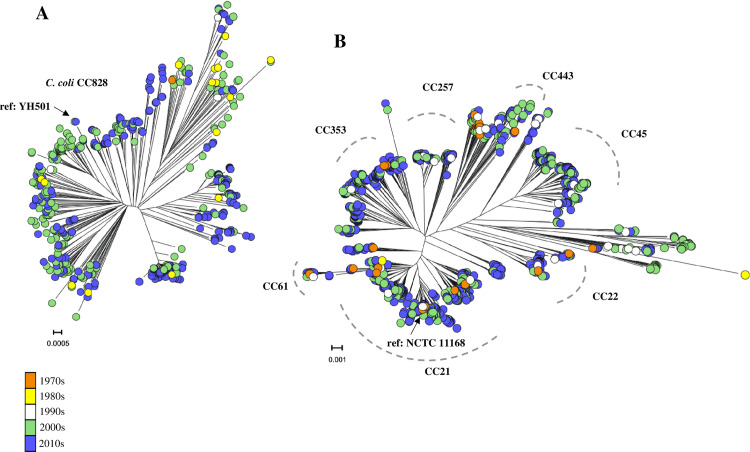
Fig 1. Little evidence of clustering of isolate sampling dates in Campylobacter phylogenies.
Maximum likelihood (ML) core genome phylogenetic trees of C. coli (A) (n = 601) and C. jejuni (B) (n = 1824) constructed using FastTree version 2.1.8 [78] and the GTR model of nucleotide evolution. Both phylogenies show the distribution of the sample time frame used in this study with major Campylobacter clonal complexes (CCs) identified and terminal nodes coloured according to isolation decade (orange = 1970s, yellow = 1980s, white = 1990s, green = 2000s, blue = 2010s). Scale bars represent the estimated number of NCs per site. Terminal nodes sampled from different decades can be seen scattered throughout both trees with little evidence of clustering by decade. Isolates sampled from the 2000s and 2010s are most abundant within each dataset. The position of the C. jejuni (NCTC11168) and C. coli (YH501) reference genomes are indicated on the phylogeny. These were sampled in 1977 and 2016 respectively.

