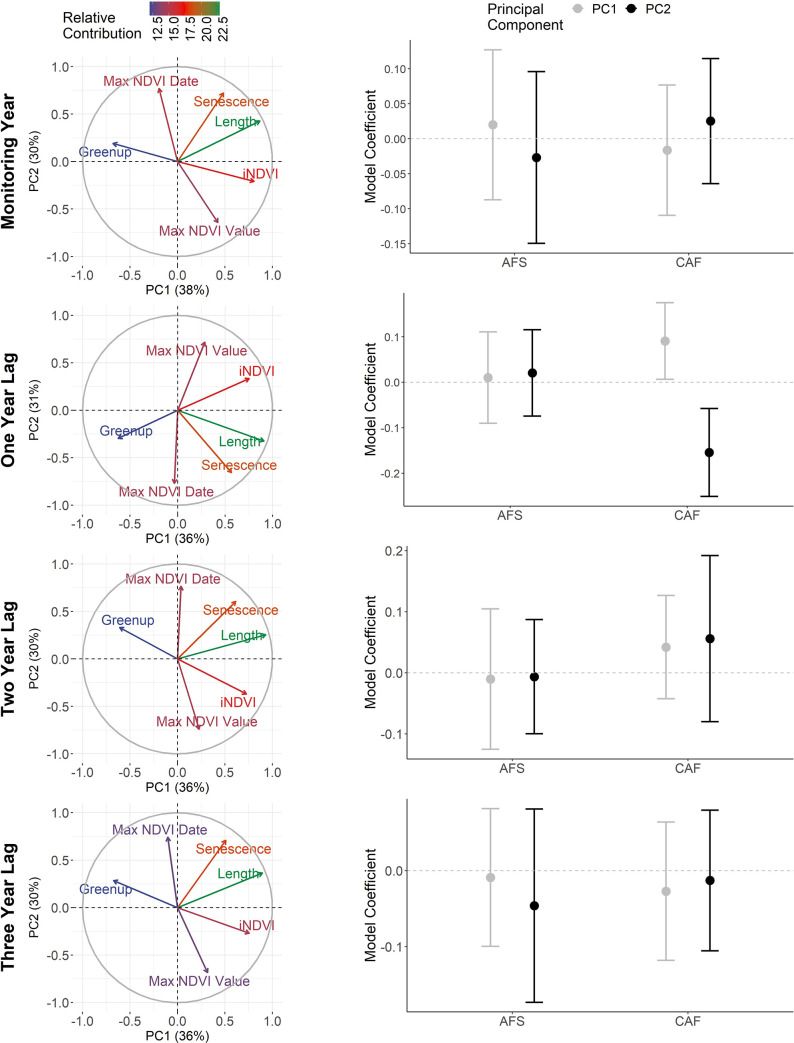
Fig 3. Relationships between the demography of woodland caribou and principal components describing the phenological growing season.
Left-column graphs depict the relative contribution of phenological variables (note: length = season length) to the first two principal components. Right-column graphs show the coefficients (with 95% CIs) for each principal component for models evaluating effects on adult female survival (AFS) and calf: adult female (CAF) ratios. Rows reflect the time frame considered.

