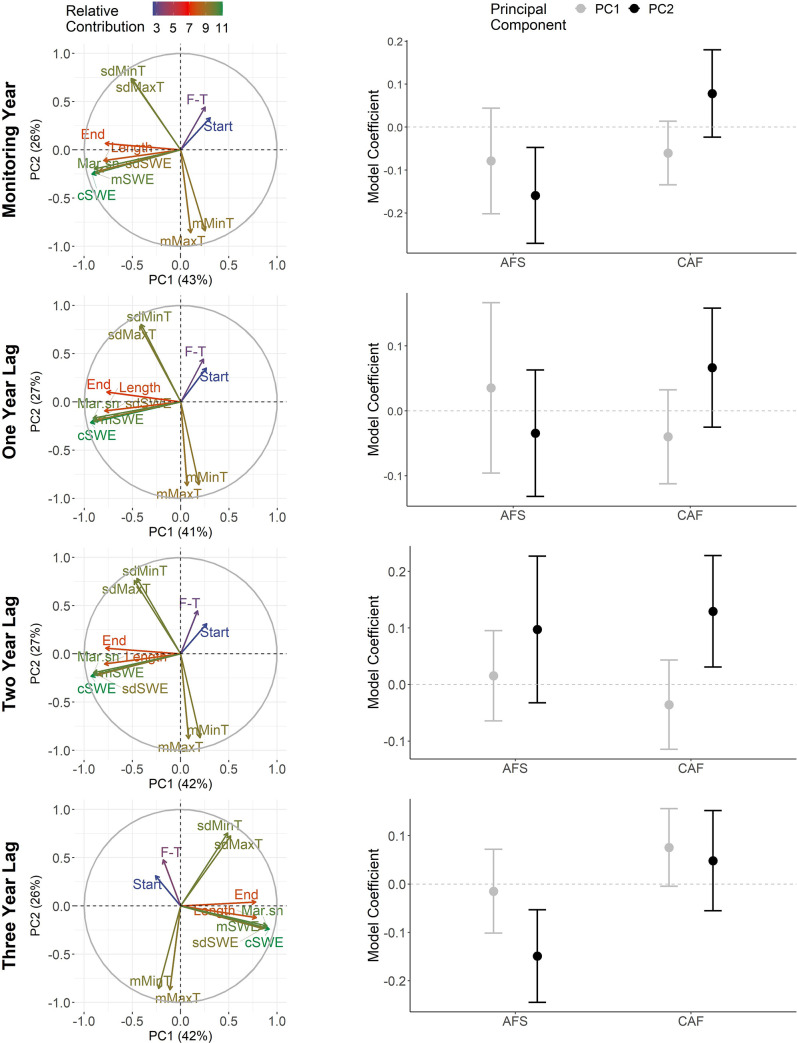
Fig 4. Relationships between the demography of woodland caribou and principal components describing the snow season.
Left-column graphs depict the relative contribution of snow season variables (Start = snow cover start, End = snow cover end, Length = season length, Mar.sn = March cumulative snow, F-T = freeze-thaw events, mMaxT = mean maximum temperature, sdMaxT = standard deviation maximum temperature, mMinT = mean minimum temperature, sdMinT = standard deviation minimum temperature, cSWE = cumulative snow water equivalents, mSWE = mean snow water equivalents, sdSWE = standard deviation snow water equivalent) to the first two principal components. Right-column graphs show the coefficients (with 95% CIs) for each principal component for models evaluating effects on adult female survival (AFS) and calf: adult female (CAF) ratios. Rows reflect the time frame considered.

