Figure 4.
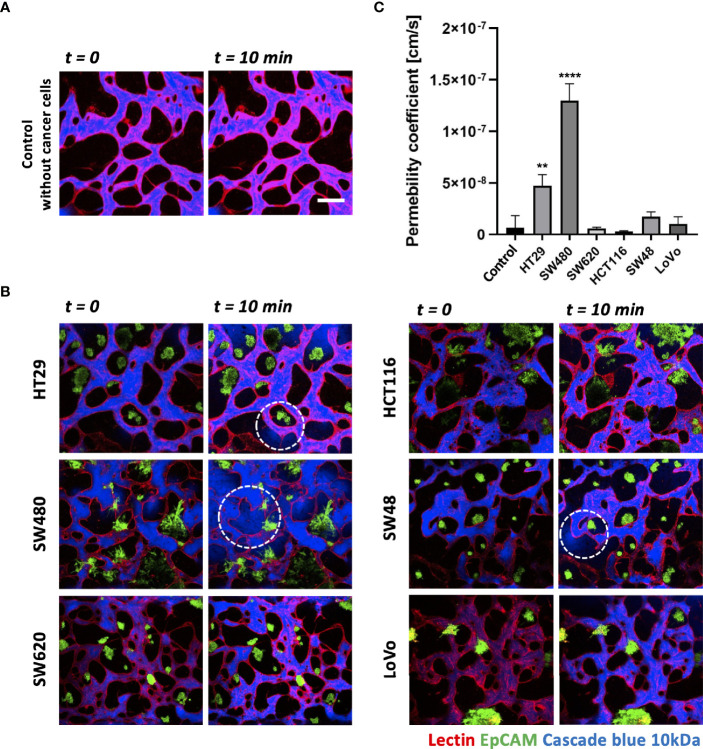
Vascular permeability of normal and tumor vasculature. (A) Time-lapse 3D confocal images of normal vasculature. Cascade blue (MW = 3kD) was used to measure vascular permeability. (B) Time-lapse 3D confocal images of tumor vasculature. Blood vessels and CRC cells were labeled with lectin (red) and EpCAM (green), respectively. The blue fluorescent dye leaked from weak tight junctions on the vascular wall marked by a white dashed circle. (C) Plot of relative permeability coefficients. HT29 and SW480 were more permeable than other conditions (n = 6 for each condition). **p < 0.01; ****p < 0.0001. Scale bar = 200 µm.

