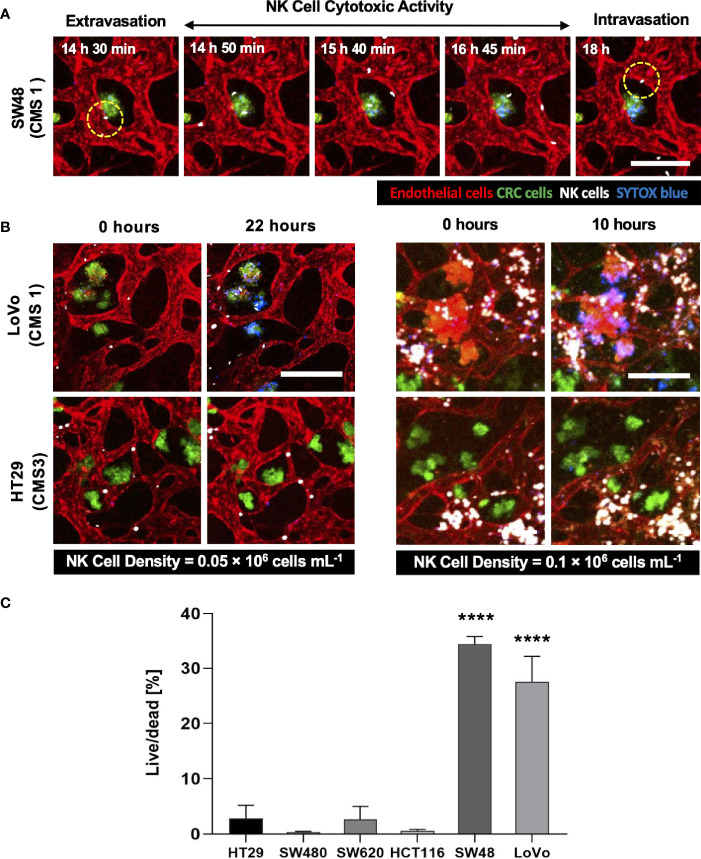
Figure 5.
3D confocal images of NK cell cytotoxicity against CRC cells. (A) Time-lapse live-cell images of NK cell extravasation, migration, and their cytotoxic activity. Live-cell imaging was performed for 24 h. (B) Validation of NK cell cytotoxicity at relatively low and high concentrations of primary NK cells. NK cells (white) showed higher cytotoxic activity against LoVo (CMS1) compared to HT29 (CMS3). As the number of NK cells increased, more CRC cells were killed in a shorter period of time. (C) Live/dead assay on 6 different CRC cell lines. The result showed different cytotoxic effects of NK cells against CRC cells. See also Supplementary Videos S1 – S6 (n = 4 for each CRC cell line). ****p < 0.0001. Scale bar = 200µm.

