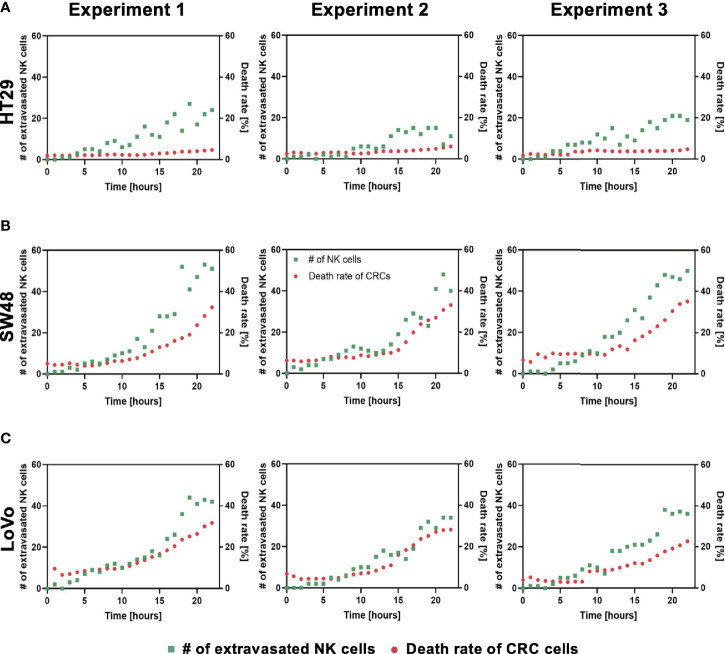
Figure 6.
Interactions between NK cell extravasation and their cytotoxic effects. (A) The number of NK cell extravasation (green) plotted with the number of cancer cells killed by NK cells (red) over time. The death rate of CRC cells showed no significant changes in HT29 (CMS3). (B) SW48 and (C) LoVo showed exponential increases in both the number of extravasated NK cells and the death rate of CRC cells. (n = 3 for each CRC cell line).

