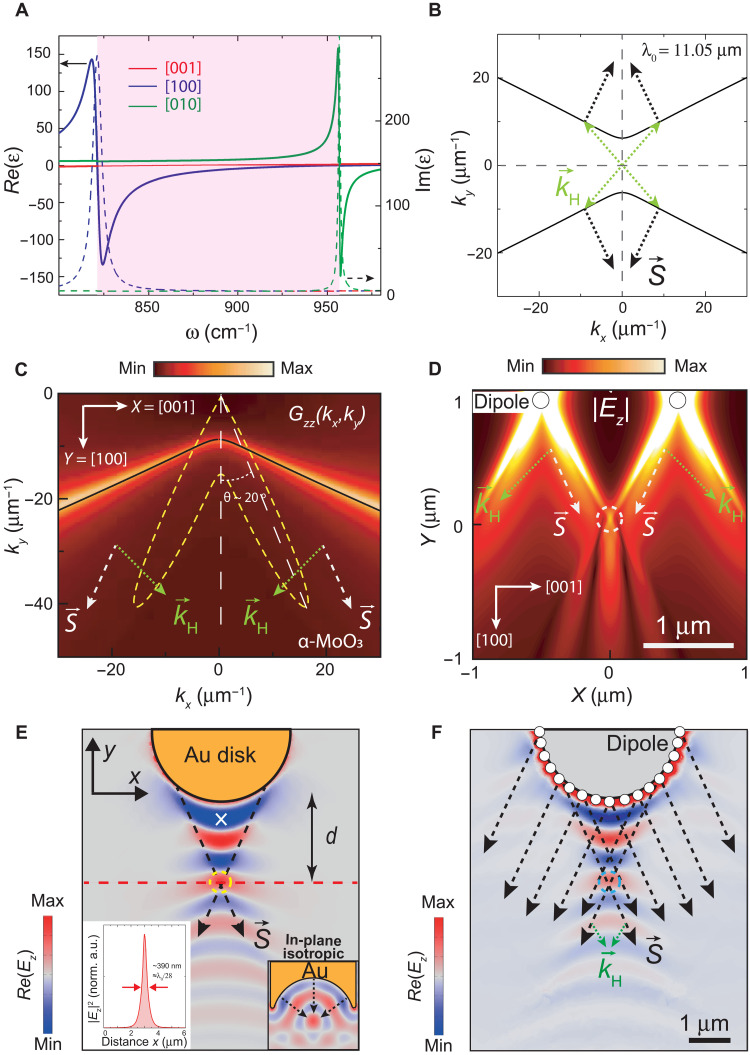
Fig. 1. Focusing of in-plane hyperbolic PhPs.
(A) IR dielectric function of α-MoO3 for the hyperbolic reststrahlen band studied in this work (shaded region). (B) IFC of in-plane hyperbolic PhPs in a 165-nm-thick α-MoO3 slab at an illuminating wavelength λ0 = 11.05 μm. PhPs with high-|| wave vectors are indicated by , together with their Poynting vector . (C) Color plot (z component of the Dyadic Green’s function) for the density of electromagnetic modes in k-momentum space (kx, ky) generated by a point dipole on α-MoO3 (λ0 = 11.05 μm). The dashed yellow line represents the pattern of the field emitted by the dipole as a function of the polar angle. (D) Near field, |Ez|, calculated analytically for two vertical point dipoles on α-MoO3. A focal spot is obtained upon interference of ray-like PhPs with wave vectors (dashed circle). (E) Simulated near field, Re(Ez), produced by a metal Au disk nanoantenna: The excitation and interference of PhPs with wave vectors lead to a focal spot (yellow dashed circle). The right inset shows the analogous case for an in-plane isotropic medium using a rod-like metal nanoantenna with a concave extremity. The left inset shows the electric field amplitude, |Ez|2, along the dashed red line (normalized to the intensity at the white cross). (F) Simulated near field, Re(Ez), for a discrete distribution of point electric dipoles localized along the periphery of a virtual disk: A convex interference pattern and focal spot (cyan dashed circle) are revealed, resembling the results obtained in (E).

