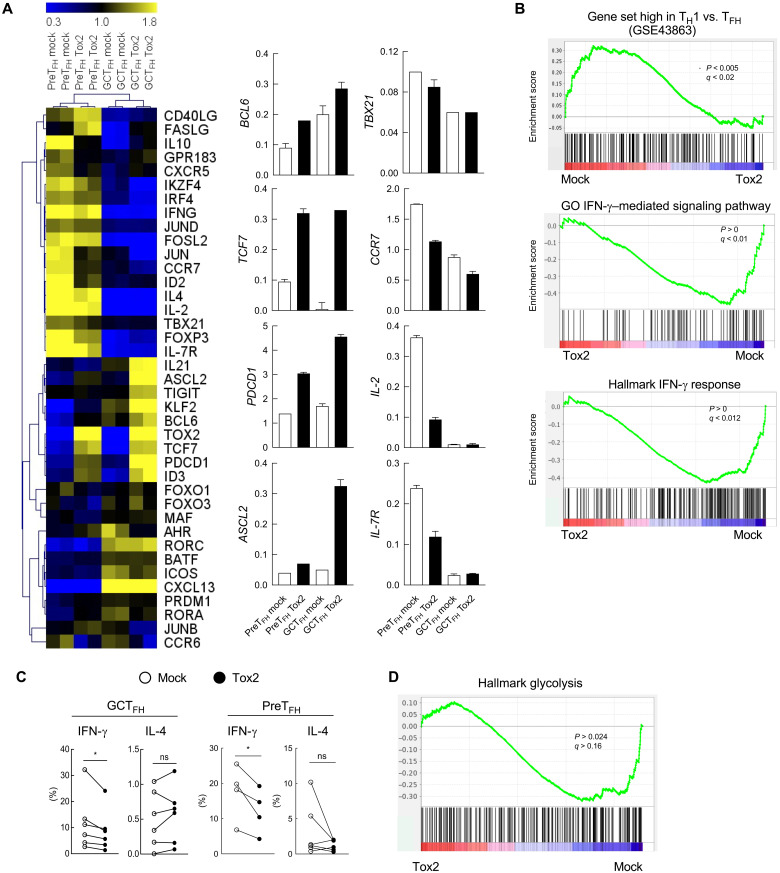
Fig. 3. Tox2 inhibits GC TFH cells to become TH1-like cells.
(A) mRNA expression of TFH-related genes analyzed by QuantiGene in mock or Tox2-overexpressing GC TFH cells and PreTFH cells (left). CD4+CD19−RFP+ cells were sorted for mRNA analysis. The results of selected genes are shown on the right. N = 2. (B) Gene-set enrichment analysis (GSEA)in mock and Tox2-overexpressing tonsillar GC TFH cells. Results with the gene set of up-regulated effector TH1 cells compared to effector TFH cells (top), the gene set of down-regulated IFN-γ–mediated pathway (middle), and the gene set of IFN-γ response (bottom). (C) Percentage of cytokine-expressing cells by mock and Tox2-overexpressing GC TFH and PreTFH cells. Cells were stimulated with phorbol 12-myristate 13-acetate (PMA) + ionomycin for 6 hours, and the frequency of intracellular IFN-γ+ and IL-4+ cells was analyzed. Dataset of four to seven experiments is shown. (D) GSEA analysis in mock and Tox2-overexpressing tonsillar GC TFH cells with the gene set of down-regulated glycolysis pathways.

