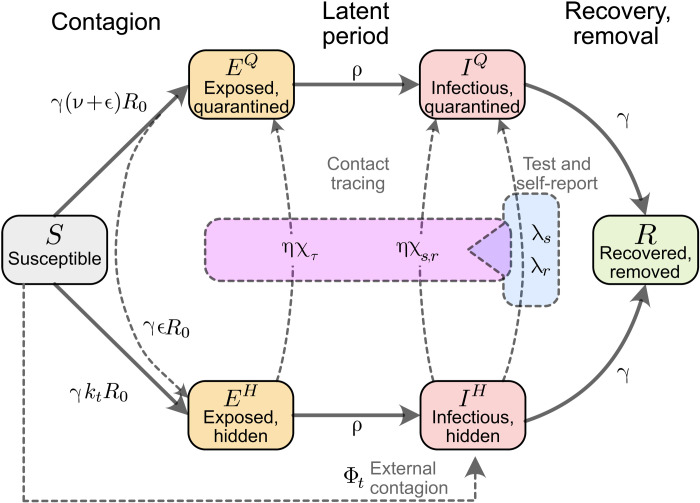
Fig. 7. Flowchart of the complete model.
The solid blocks in the diagram represent different SEIR compartments for both hidden and quarantined individuals. Hidden compartments account for both symptomatic and asymptomatic carriers (as described in Methods). Solid lines represent the natural progression of the infection (contagion, latent period, and recovery). On the other hand, dashed lines account for imperfect quarantine and limited compliance, external factors, and TTI policies.

