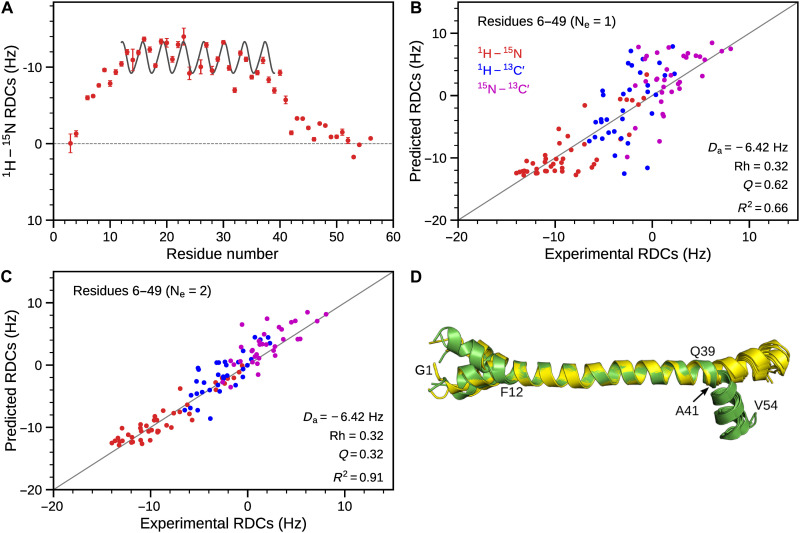
Fig. 3. Solution structure of mHR1.
(A) 1H-15N RDCs obtained in stretched positively charged polyacrylamide gel. Red circles represent experimental data, and the sinusoid corresponds to the best-fitted dipolar wave pattern (28) for residues N13 to Q39, with a root mean square deviation of 1.6 Hz against an idealized helical structure. Plotted values ignore the negative sign of γ(15N); i.e., |1JNH + 1DNH| values are smaller than 90 Hz. Cross-validation SVD fits of experimental RDCs obtained in positively charged polyacrylamide gel against (B) a single best-fit structure and (C) a two-member ensemble structure. Structure calculations were carried out 44 times, each time excluding all RDCs for a given amide, and predicted RDCs for the amide were obtained from the lowest-energy structure. RDCs for 1DNH, 1DNC′ (one-bond 15N-13C′), and 2DHC′ (two-bond 1H-13C′) are shown in red, purple, and blue, respectively. 1DNC′ and 2DHC′ were upscaled by factors of 3.1 and 8.27, respectively, ignoring the effect of the sign of the 15N gyromagnetic ratio on the RDC, thereby ensuring that normalized RDCs of the same value correspond to the same orientational restraint. (D) Overlay of five lowest-energy RDC-refined structures of mHR1 displaying two distinct (yellow and green) conformations. A kink is observed at A41 for the ensemble fraction shown in green.

