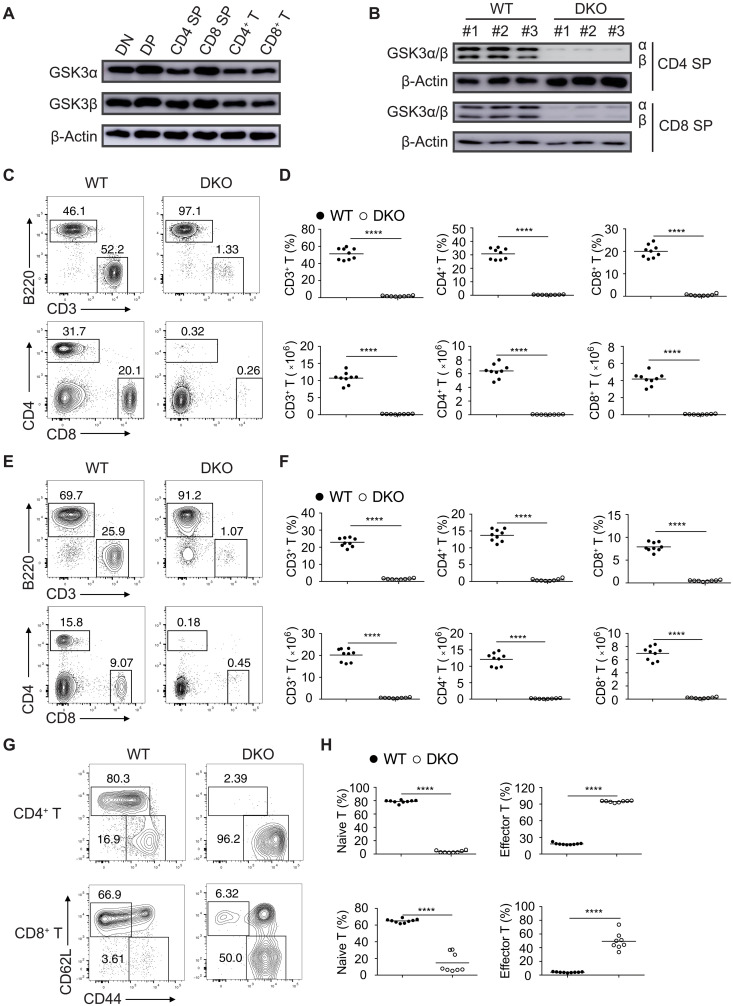
Fig. 1. T cell lymphopenia in mutant mice with T cell–specific deletion of GSK3.
(A) Immunoblot analysis of GSK3α and GSK3β in DN, DP, CD4, and CD8 SP thymocytes and peripheral CD4+ and CD8+ T cells. (B) Immunoblot analysis of GSK3α and GSK3β in CD4 and CD8 SP thymocytes from wild-type (WT) and Gsk3a−/−b−/− (DKO) mice. Numbers indicate three mice per group. (C to F) Flow cytometry analysis of CD3+ T and B220+ B cells (top) and CD4+ and CD8+ T cells (bottom) in the lymph nodes (C) and spleen (E) of 4- to 6-week-old WT and DKO mice. Summary of the percentage and number of CD3+ T cells (left), CD4+ T cells (middle), and CD8+ T cells (right) in the lymph nodes (D) and spleen (F) of WT and DKO groups (n ≥ 8 per group). (G) Flow cytometry analysis of naive (CD62L+CD44−) and activated (CD62L−CD44+) T cells among CD4+ and CD8+ T cells in the spleen of WT and DKO mice. (H) Summary of the percentages of naive and activated T cells from (G). Each symbol represents an individual mouse; small horizontal lines indicate the mean (± SEM). ****P < 0.0001. Data are representative of at least three independent experiments.

