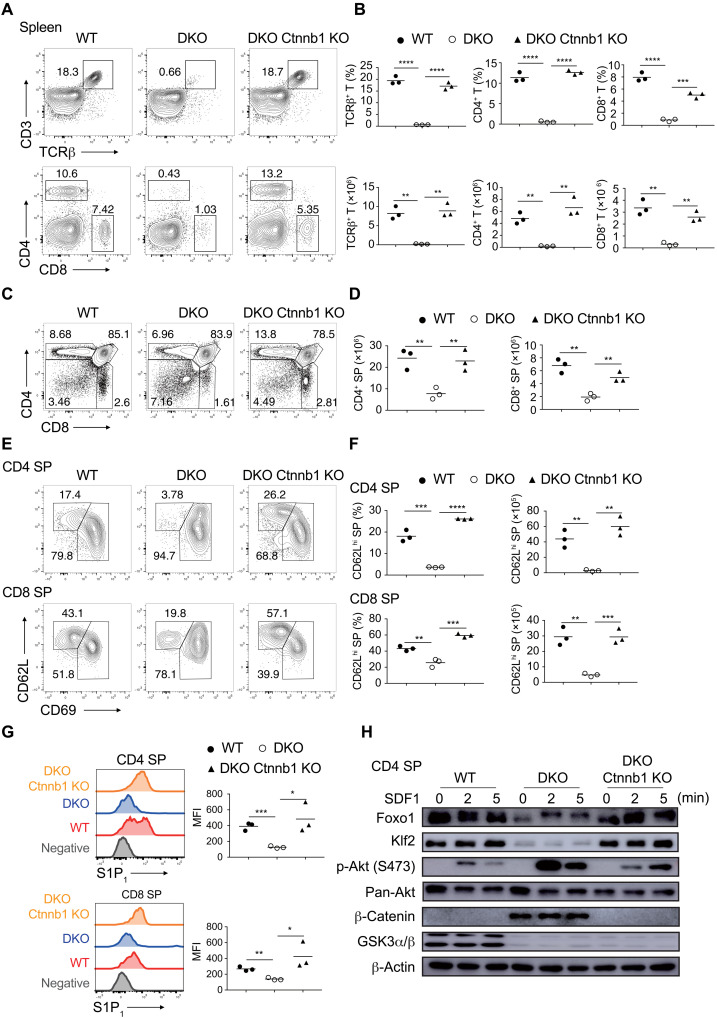
Fig. 7. Ctnnb1 deletion restores the egress of GSK3-deficient thymocytes.
(A) Flow cytometry analysis of CD3+TCRβ+ (top), CD4+, and CD8+ T (bottom) cells in the spleen of 4- to 6-week-old WT, DKO, and Gsk3a−/−b−/−Ctnnb1−/− (DKO Ctnnb1 KO) mice. (B) Summary of the percentage (top) and number (bottom) of CD3+TCRβ+, CD4+, and CD8+ T cells in (A) (n = 3 per group). (C) Flow cytometry analysis of thymocyte development in mice in (A). (D) Summary of numbers of CD4 and CD8 SP thymocyte in (C). (E) Flow cytometry analysis of CD62LhiCD69lo cells among CD4 (top) and CD8 (bottom) SP thymocytes in mice in (A). (F) Summary of the percentage and number of CD62LhiCD69lo cells among CD4 and CD8 SP cells in (E). (G) S1P1 expression on CD62LhiCD69lo CD4 (top) and CD8 (bottom) SP thymocytes in mice in (A) was analyzed by flow cytometry. CD62LloCD69hi cells as a negative control (gray). Right: MFI of S1P1 expression on CD62LhiCD69lo CD4 and CD8 SP thymocytes of indicated genotypes. (H) Immunoblot analysis of the Akt-Foxo1-Klf2 pathway in CD4 SP thymocytes stimulated with SDF1 for indicated amounts of time. Each symbol represents an individual mouse. Small horizontal lines indicate the mean (± SEM). *P < 0.1; **P < 0.01; ***P < 0.001; ****P < 0.0001. Data are representative of at least three independent experiments.

