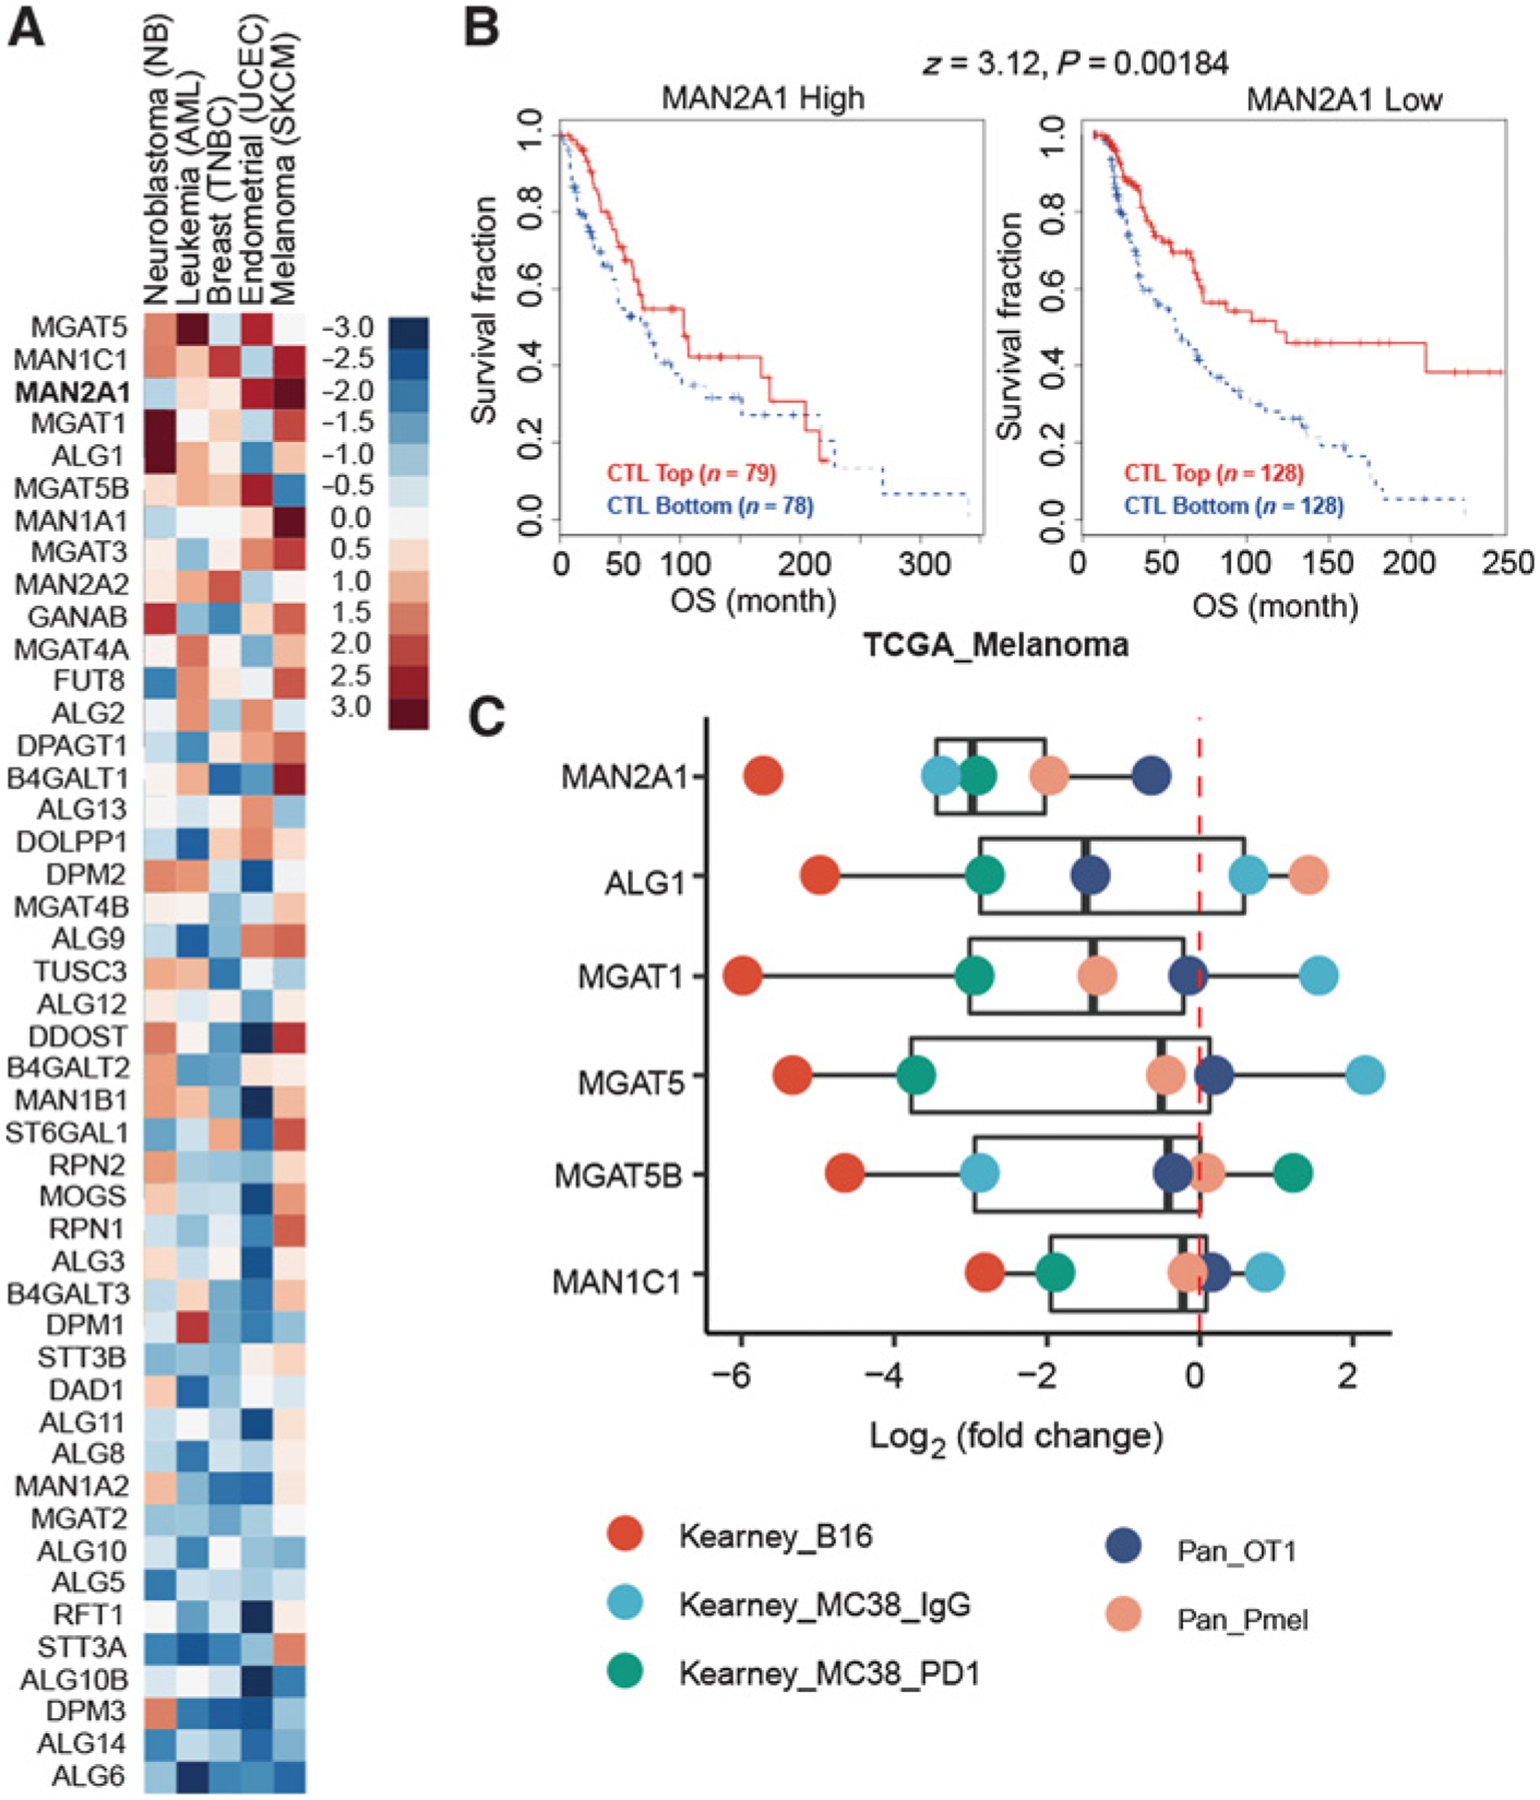
Figure 1.

MAN2A1 is associated with T-cell dysfunction. A, T-cell dysfunction scores of N-glycan biosynthesis genes in the five TIDE core datasets. N-glycan biosynthesis genes were collected from KEGG_N_GLYCAN_ BIOSYNTHESIS (hsa00510). Five data sets, representing five cancer types, had more than 1% of genes with FDR > 0.1. The gene list was ranked by the average T-cell dysfunction score of the five cancer types. B, The association between the CTL level and overall survival for patients with different MAN2A1 levels in TCGA melanoma cohort. The CTL infiltration level was estimated as the average expression level of CD8A, CD8B, GZMA, GZMB, and PRF1. The association between the CTL level and overall survival was computed through the two-sided Wald test in the Cox-PH regression. “CTL Top” means samples have above-average CTL values among all samples, whereas “CTL Bottom” means below average. Samples were split by the best separation strategy according to the MAN2A1 expression coefficients in the Cox-PH regression model. C, Log2 fold change of genes with high dysfunction score in the public T-cell coculture screen data. MAGeCK was used to compute the log2 fold change for all gRNAs by comparing the experimental and control conditions.
