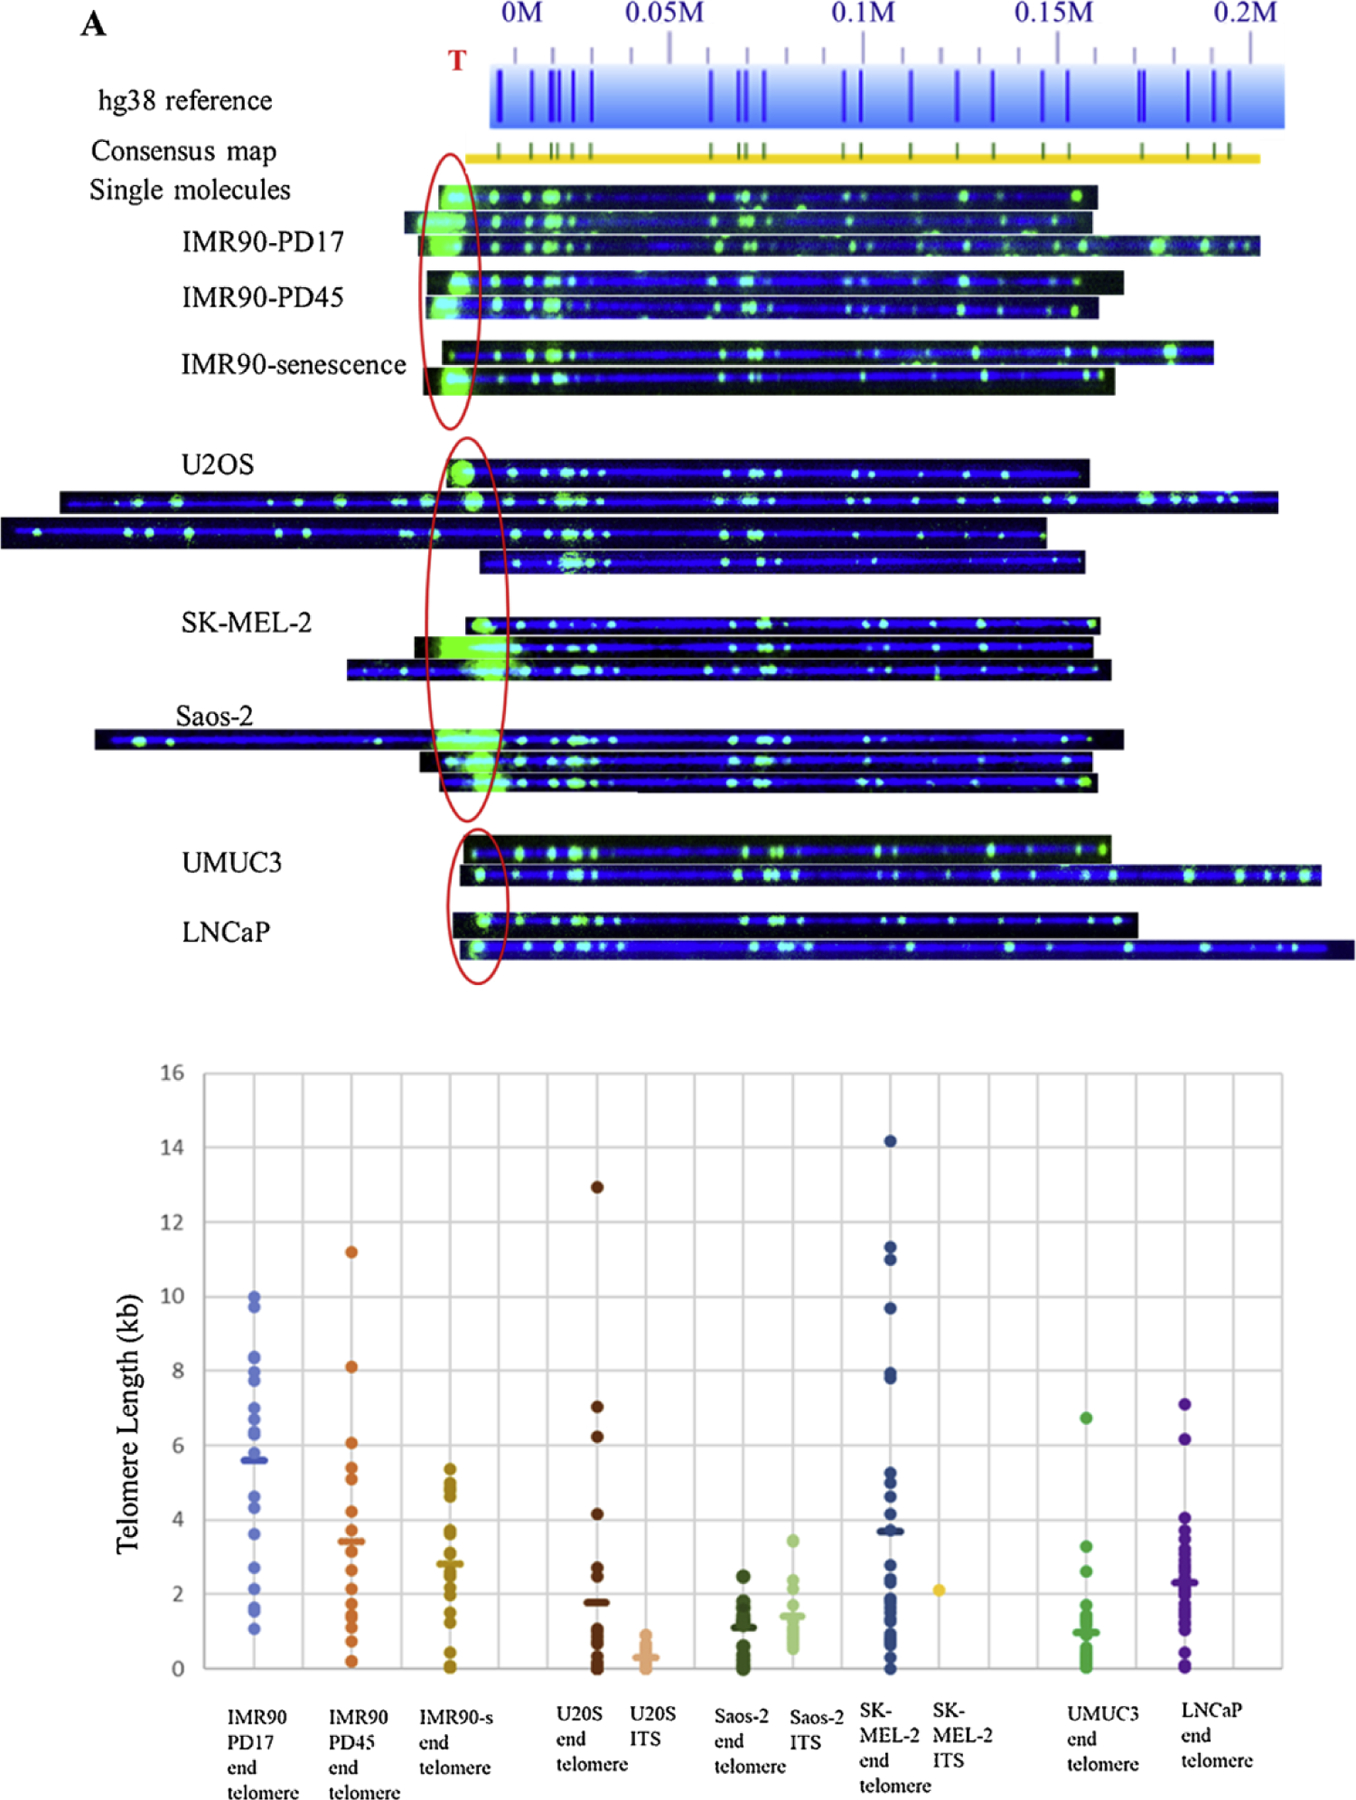
Fig. 3.

Comparison of 8q molecules across various cell lines. A) Raw microscope images of 8q molecules across among aging (IMR90 fibroblasts), ALT-positive (U2OS, SK-MEL-2, Saos-2), and telomerase-positive (UMUC3 and LNCaP) cell lines. Reference genome hg38 appears as light blue bar with dark blue marks where the Nt, BspQI nick-label sites occur. Blue numbers above the reference indicate the location in million base pair scale. For example, 0.1 M = 0.1 × 10^6 bp from the chromosome end as indicated in hg38 reference. De novo assembled consensus maps are shown as yellow lines with vertical blue and green marks. Green marks show the Nt. BspQI sites that align to the reference and light blue marks show non-aligned sites. Telomere labels are shown in red circle. Long telomere lengths were observed in early passages and decreased with increasing passage number. ALT-positive cells had a heterogeneous distribution of telomere lengths. Also, an example of recombinant molecule with ITS can be seen in Saos-2 group. Very short telomere ends consistent with ‘t-stumps’ observed in telomerase-positive cells, B) Plot showing the distributions of telomere length I measured at 8q molecules across among IMR90 aging cells (light blue, orange, mustard dots representing early, late and senescent passages respectively), U2OS (brown), Saos-2 (dark green), SK-MEL-2(dark blue) ALT-positive, and UMUC3 (bright green), LNCaP (purple) telomerase-positive cell lines. Each dot represents a single telomere length measurement, and the average length is marked as the short horizontal bar. The lengths of ITS sequences observed in each of the ALT-positive cell lines are represented as pink (U2OS), light green (Saos-2) and yellow (SK-MEL-2) dots.
