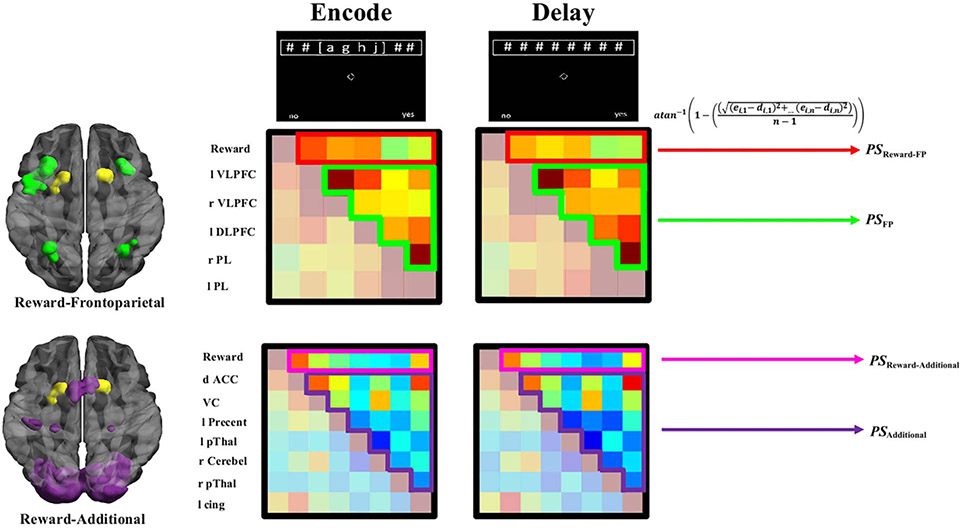
Figure 4.
Conceptual overview of functional connectivity pattern stability estimates by circuit. Reward node (yellow), frontoparietal (FP; green), and additional WM-circuit (purple) nodes comprising different circuits. Example of weighted matrices of correlation patterns by circuit and phase. Emphasized portions of these matrices are input into Equation 1 to derive PS for a given node, for a given participant. Regions (top–bottom): Reward = reward node; l VLPFC = left ventrolateral pFC; r VLPFC = right ventrolateral pFC; l DLPFC = left dorsolateral pFC; r PL = right parietal lobule; l PL = left parietal lobule; d ACC = dorsal ACC; VC = visual cortex; l Precent = left precentral gyrus; l pThal = left posterior thalamaus; r Cerebel = right cerebellar lobule VII; r pThal = right posterior thalamus; l Cingulate = left cingulate. See Tables 3 and 4 for anatomical labels and Montreal Neurological Institute coordinates.

