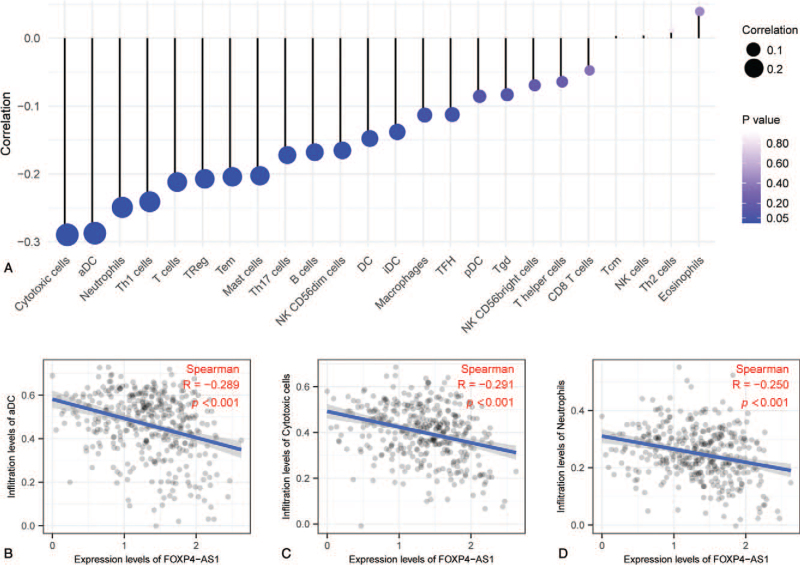
Figure 4.
Correlation analysis between FOXP4-AS1 and related immune cell markers in ovarian serous cystadenocarcinoma. Correlation analysis between FOXP4-AS1 expression and immune cells (A); Correlation analysis between FOXP4-AS1 expression and levels of DC cell infiltration markers (B) and those of cytotoxic cells (C) and neutrophils (D).

