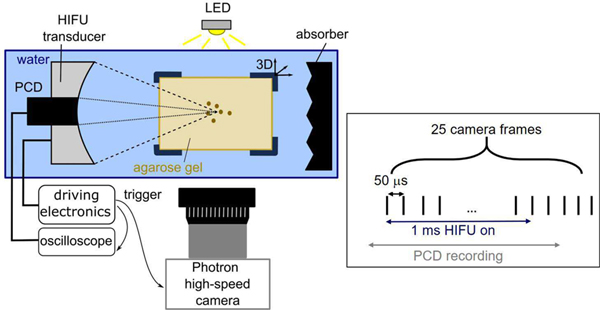
Fig. 1.
Schematic diagram of the experimental setup. A single 1 ms HIFU pulse was delivered to each location in the agarose gel, and the ensuing cavitation bubble activity was observed using coaxial passive cavitation detection (PCD) and high-speed photography with backlighting. The relative timing of the HIFU pulse, high-speed camera recording, and PCD recording are illustrated on the right.

