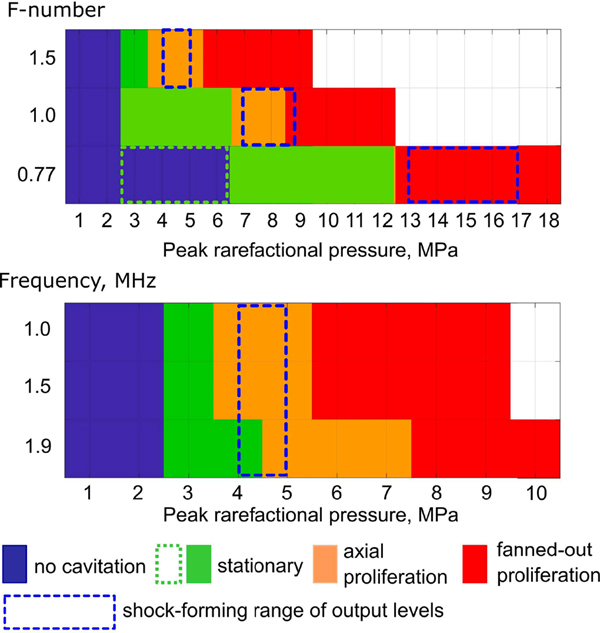
Fig. 6.
Dependence of observed cavitation behavior on peak rarefactional pressure for transducers with different F-numbers at 1.5 MHz (top) and for the transducer with F-number of 1.52 at different frequencies (bottom). Specific behaviors were assigned if they were observed at least once for corresponding acoustic parameters. Dashed blue boxes indicate the range of output levels from the start of shock front formation to formation of the developed shock at the focus. Dotted green box indicates that cavitation activity was detected with PCD, but not with high-speed photography.

