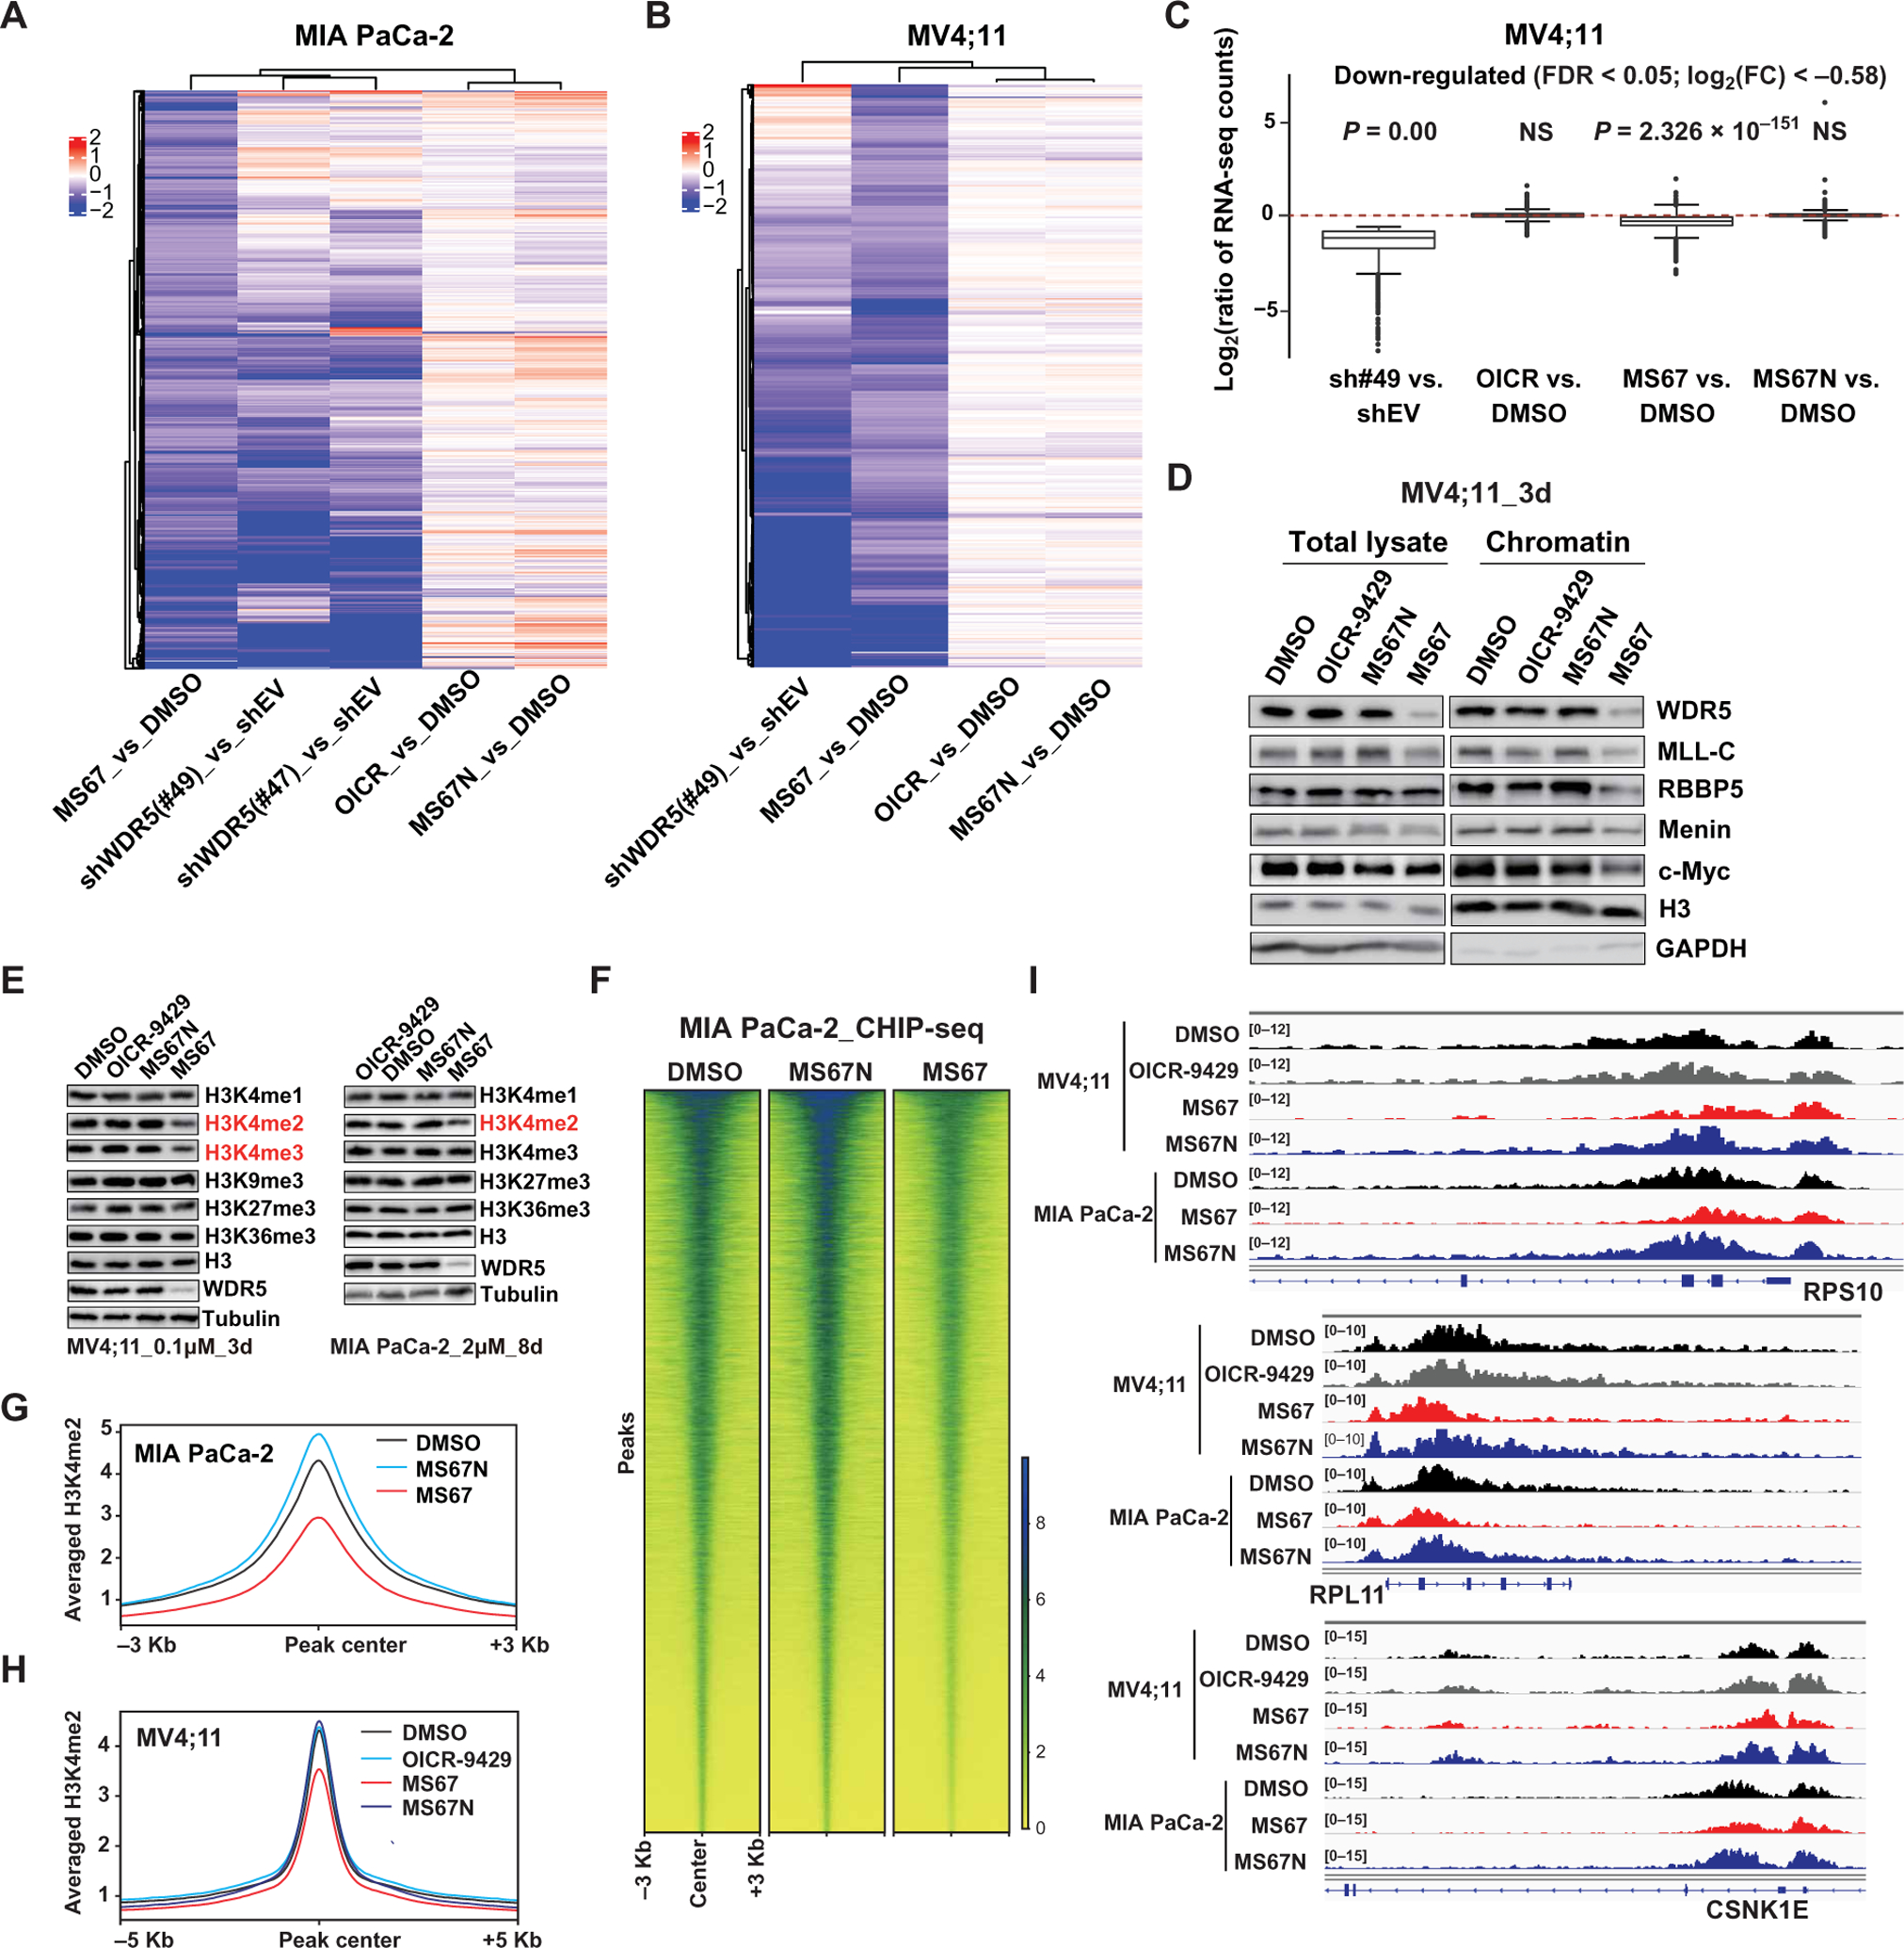
Fig. 5. MS67 is effective in suppressing transcription of WDR5-regulated genes and H3K4me2 on chromatin.

(A) Heatmaps using the indicated sample comparisons show log2 ratios for 842 genes significantly down-regulated in MIA PaCa-2 cells after a 6-day treatment with 1 μM MS67, relative to mock. Down-regulation is determined with a cutoff of log2[fold change (FC)] less than −0.58 and false discovery rate (FDR) less than 0.05. Comparisons were done using RNA-seq profiles of cells transduced with a WDR5-targeting shRNA (either sh#47 or sh#49) versus empty vector (shEV) (0.5 μg/ml Dox, 4-day treatment) and cells treated with OICR-9429 (1 μM, 6-day treatment) versus DMSO, MS67N (1 μM, 6-day treatment) versus DMSO, or MS67 (1 μM, 6-day treatment) versus DMSO. (B) Heatmaps using the indicated sample comparisons show log2 ratios for 464 genes significantly down-regulated in MV4;11 cells after a 3-day treatment with 0.1 μM MS67, relative to mock. Down-regulation is determined with a cutoff of log2(FC) less than −0.58 and FDR less than 0.05. Comparison was done using RNA-seq profiles of cells transduced with sh#49 versus shEV (0.5 μg/ml Dox, 4-day treatment) and cells treated with OICR-9429 (0.1 μM, 3-day treatment) versus DMSO, MS67N (0.1 μM, 3-day treatment) versus DMSO, or MS67 versus DMSO. (C) Box plots showing the log2 ratios for genes showing 1529 significant down-regulation in MV4;11 cells transduced with a WDR5-targeting shRNA(sh#49), relative to shEV. Comparison was done across sh#49 versus shEV, OICR-9429 versus DMSO, MS67N versus DMSO, and MS67 versus DMSO. P value was generated for each comparison. NS, not significant. (D) Immunoblots for the indicated MLL-complex proteins and c-MYC, either in total cell extract or in chromatin-bound fractions, in MV4;11 cells treated with DMSO or 0.1 μM OICR-9429, MS67N, or MS67 for 3 days. GAPDH, glyceraldehyde-3-phosphate dehydrogenase. (E) Immunoblots for the indicated histone modifications (with H3 as a loading control) and WDR5 (with Tubulin as control) posttreatment of MV4;11 cells (left; 0.1 μM for 3 days) or MIA PaCa-2 cells (right; 2.0 μM for 8 days) with DMSO, OICR-9429, MS67N, or MS67. (F) Heatmap showing the H3K4me2 density of ±3 Kb around the called peaks, as assessed by the spike-in normalized ChIP-seq profiles of MIA PaCa-2 cells treated with DMSO (left), MS67N (2 μM) (middle), or MS67 (2 μM) (right) for 8 days. (G and H) Averaged H3K4me2 ChIP-seq signals at the called peaks identified under the mock-treated condition posttreatment of MIA PaCa-2 (G) (2 μM for 8 days) and MV4;11 cells (H) (0.1 μM for 3 days) with DMSO, OICR-9429, MS67N, or MS67. (I) Integrative Genomics Viewer (IGV) views of the indicated gene locus (RPS10, RPL11, and CSNK1E) showing the H3K4me2 decrease induced by treatment of MV4;11 (0.1 μM for 3 days) and MIA PaCa-2 cells (2 μM for 8 days) with MS67 in comparison with DMSO, OICR-9429, or MS67N treated.
