Figure 3.
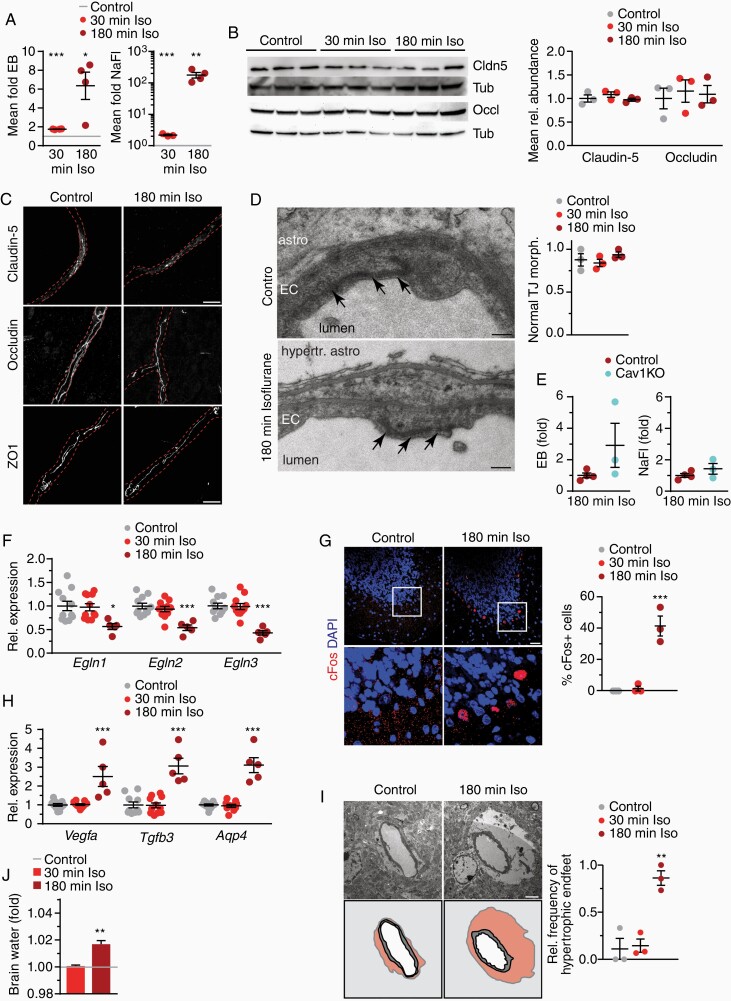
Prolonged exposure to isoflurane induces brain edema. (A) Extravasation of tracers ± SEM after 2.5% isoflurane compared to controls (gray line; n = 4 animals, 1-way ANOVA with Dunnett’s test). (B) Immunoblot of brain lysates from isoflurane-treated mice and for claudin-5, occluding, and tubulin with quantification (n = 3 animals). (C) Images of brain sections immunostained for tight junction proteins with vessel outline (dashed lines) from lectin co-staining (scale 10 µm). (D) Normal ultrastructure of EC tight junctions (arrows) (astro, astrocyte; hypertr. astro, hypertrophic astrocyte; scale 200 nm) with quantification of the mean ratio of normal-appearing tight junction profiles below (23–37 vessels from n = 3 animals). (E) Extravasation of tracers ± SEM after 2.5% isoflurane for 180 min in WT and Cav1KO mice (n = 3–4 animals). (F) Mean gene expression of Egln1-3 ± SEM in brain from isoflurane-treated mice compared to controls (n = 5–11 mice, 1-way ANOVA with Dunnett’s test). (G) cFos immunostaining of cerebellum from mice treated with isoflurane shows frequent staining in Purkinje neurons (scale 25 µm) with quantification (n = 3 animals, 1-way ANOVA with Dunnett’s test). (H) Mean expression of genes encoding Hif1αtarget genes as indicated ±SEM in brain tissue of mice treated with isoflurane compared to controls (n = 5–11 mice, 1-way ANOVA with Dunnett’s test). (I) Swollen astrocyte endfeet around capillaries after 180 min of isoflurane administration (n astrocyte nucleus, v vessel, pseudocolored in the cartoon below, scale 2 µm) with quantification of mean frequency compared to controls (n = 3 animals, 1-way ANOVA with Dunnett’s test). (J) Mean brain water content indicative of edema in controls (gray line) or mice exposed to isoflurane (n = 4–5 animals, unpaired Student’s t-test to control animals).

