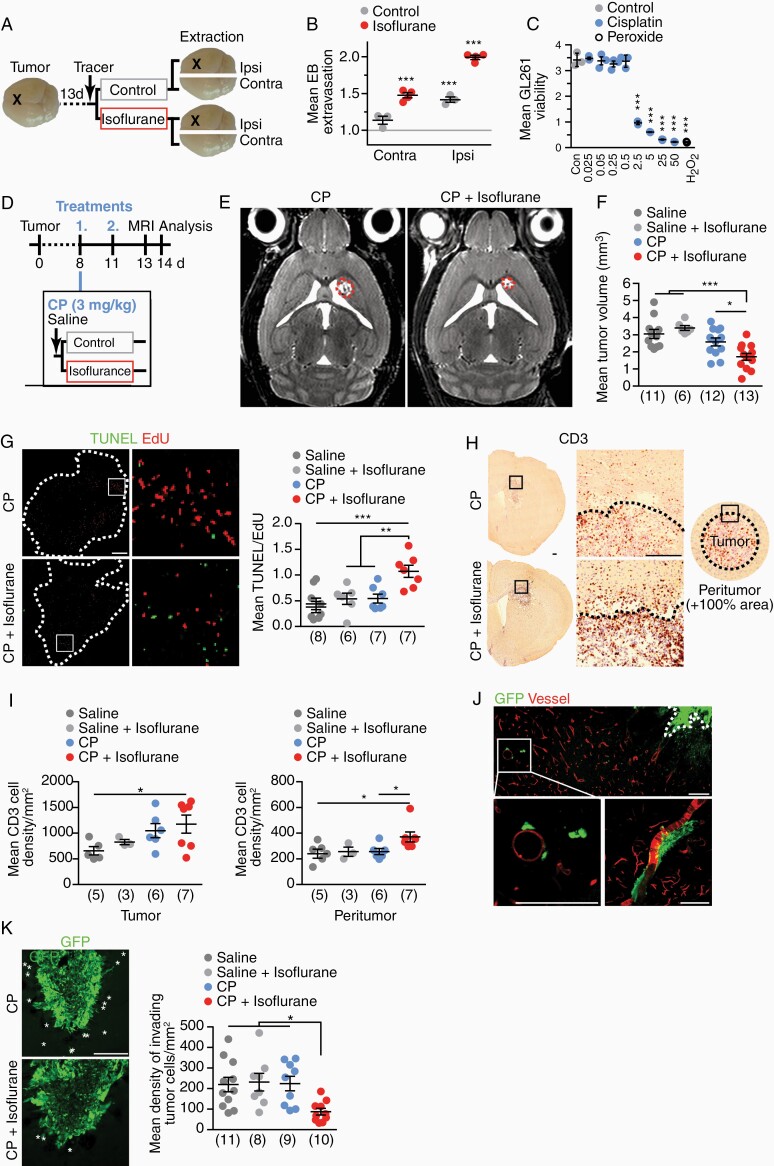
Figure 4.
Isoflurane supports cisplatin treatment of glioma in mice. (A) At 14 d after GL261 tumor cells implantation (X), EB was i.v. injected and mice were treated with 2.5% isoflurane for 30 min. Extravasated tracer was quantified in the ipsilateral tumor-bearing or the contralateral hemispheres. (B) EB extravasation ± SEM in tumor-implanted mice treated as depicted in (A), normalized to control mice set to 1 (gray line; n = 3, 1-way ANOVA with Tukey’s test). (C) Viability of GL261 tumor cells ± SEM treated with increasing CP concentrations for 72 h measured (n = 3, 1-way ANOVA with Dunnett’s test). (D) Treatment scheme of glioma with CP chemotherapy with supportive isoflurane application. At 8 dpi and 11 dpi, mice received chemotherapy. Tumor volume was assessed by MRI at 13 dpi. Mice were euthanized at 14 dpi. (E) MRI images of mice treated as depicted in (D) with tumor outline as dashed line. (F) Tumor volume ± SEM (n = 6–13 as indicated in brackets, 1-way ANOVA with Dunnett’s test). (G) TUNEL and EdU colabeled brain section (tumor outline dashed, scale 200 µm) with boxed area enlarged on the right. TUNEL/EdU ratio ± SEM of tumors as readout of treatment efficacy (n = 6–8 as indicated in brackets, 1-way ANOVA with Dunnett’s test). (H) Tumor and peritumor areas used for quantification (scale 200 µm). (I) CD3+ T lymphocytes in tumor (left) and peritumor areas (right) ± SEM (n = 6–13 as indicated in brackets, 1-way ANOVA with Dunnett’s test). (J) Representative images of GFP fluorescence (tumor cells) in tumor-implanted mice at 7dpi. Vessels were stained by DiD vessel paint (scale 25 µm). (K) Invading tumor cells marked by asterisks (scale 200 µm). Density of invading GFP-positive tumor cells ± SEM (n = 8–11, 1-way ANOVA with Dunnett’s test).

