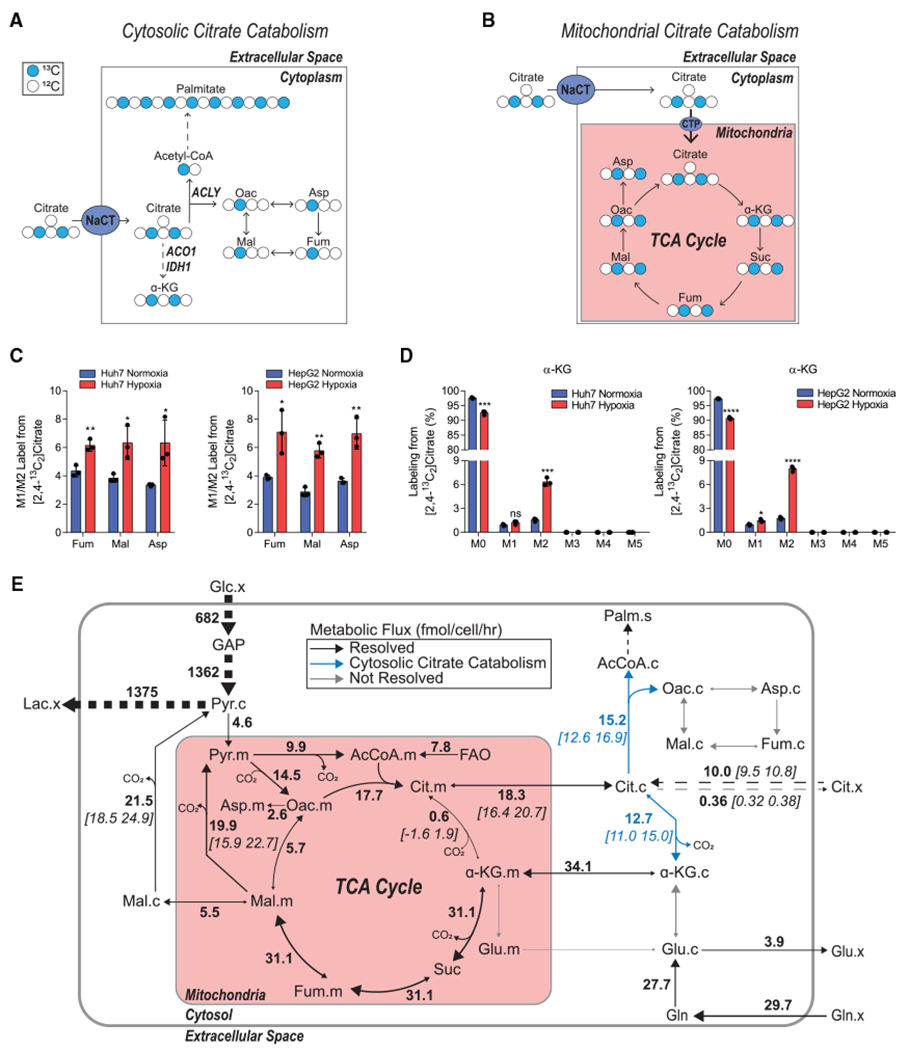
Figure 4. Extracellular citrate is primarily catabolized in the cytosol.

(A) Schematic of extracellular [2,4-13C2]citrate catabolism in the cytosol. Closed circles indicate 13C carbon, and open circles indicate 12C carbon.
(B) Schematic of extracellular [2,4-13C2]citrate catabolism in the mitochondria. Closed circles indicate 13C carbon, and open circles indicate 12C carbon.
(C) Ratio of the relative abundance of M1/M2 TCA intermediates from 500 μM [2,4-13C2]citrate in Huh7 (left) and HepG2 (right) cells grown in normoxia or hypoxia for 48 h (n = 3).
(D) Mass isotopomer distribution of α-KG from 500 μM [2,4-13C2]citrate in Huh7 (left) and HepG2 (right) cells grown in hypoxia for 48 h (n = 3).
(E) Schematic of central carbon metabolism with net fluxes and selected CIs estimated by 13C MFA for Huh7 cells grown in DMEM with 500 μM citrate in hypoxia for 48 h. Net flux values are listed adjacent to reaction arrows, with 95% CIs in square brackets. Dashed arrows represent grouped reactions. Some net or exchange fluxes for compartmentalized, parallel reactions were not resolvable.
Cit, citrate; Oac, oxaloacetate; Fum, fumarate; Mal, malate; Asp, aspartate; α-KG, α-ketoglutarate; Glc, glucose; Gln, glutamine; Glu, glutamate; Lac, lactate; GAP, glyceraldehyde 3-phosphate; Palm, palmitate; FAO, fatty acid oxidation. In all graphs, data are plotted as means ± SD. Statistical significance is relative to normoxia as determined by two-sided Student’s t test with *p < 0.05; **p < 0.01; ***p < 0.001; ****p < 0.0001. Unless indicated, all data represent biological triplicates. Data shown are from one of at least two separate experiments.
