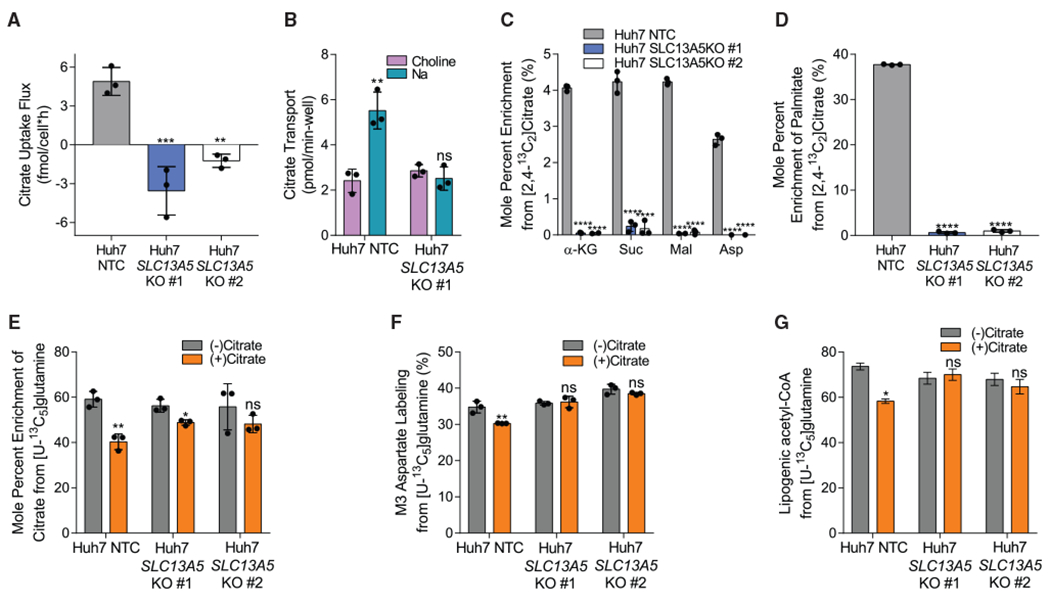
Figure 5. NaCT supports extracellular citrate import and metabolism in hepatocellular carcinoma cells.

(A) Citrate uptake flux in Huh7 NTC and SLC13A5 KO cells grown in hypoxia for 48 h (n = 3).
(B) Citrate transport in Huh7 NTC and SLC13A5 KO #1 cells (n = 3).
(C) Mole percent enrichment of TCA intermediates from [2,4-13C2]citrate in Huh7 NTC and SLC13A5 KO cells grown in hypoxia for 48 h (n = 3).
(D) Mole percent enrichment of palmitate from [2,4-13C2]citrate in Huh7 NTC and SLC13A5 KO cells grown in hypoxia for 48 h (n = 3).
(E) Mole percent enrichment of citrate from [U-13C5]glutamine in Huh7 NTC and SLC13A5 KO cells ± 500 μM citrate grown in hypoxia for 48 h (n = 3).
(F) Percent labeling of M3 aspartate from [U-13C5]glutamine in Huh7 NTC and SLC13A5 KO cells ± 500 μM citrate grown in hypoxia for 48 h (n = 3).
(G) Percentage of lipogenic acetyl-CoA contributed by [U-13C5]glutamine in Huh7 NTC and SLC13A5 KO cells ± 500 μM citrate grown in hypoxia for 48 h (n = 3).
α-KG, α-ketoglutarate; Suc, succinate; Mal, malate; Asp, aspartate. In all graphs data are plotted as means ± SD. Statistical significance is relative to NTC as determined by one-way ANOVA with Dunnett’s method for multiple comparisons (A, C, and D) or relative to (−) citrate as determined by two-sided Student’s t test (B, E, and F) with *p < 0.05; **p < 0.01; ***p < 0.001; ****p < 0.0001. In (G), data are plotted as mean ± 95% CI. Asterisk (*) indicates statistical significance by non-overlapping CIs. Unless indicated, all data represent biological triplicates. See also Figures S3 and S4. (C–G) Data shown are from one of at least two separate experiments.
