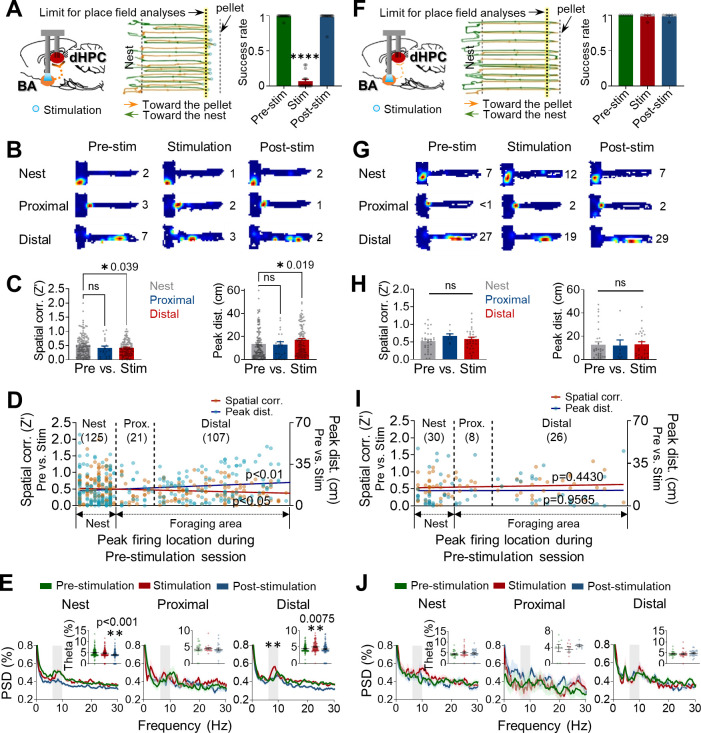
Figure 4. Optogenetic stimulations of the amygdala alter the stability of place cells.
(A–E) Data were collected from rats exhibiting defensive behaviors responding to the photostimulation. (A) An illustration showing that optogenetic stimulation of the basal amygdala (BA) presumably sends strong (primarily polysynaptic) inputs to the dorsal hippocampus (dHPC) when the stimulations elicited behavioral effects (left). A representative tracking plot during the stimulation session (middle). Orange lines and blue circles indicate the outbound trails and stimulation locations, respectively, that evoked escape responses (green lines). The yellow-tinted dotted line represents the limit of place field analyses. The success rate of pellet retrieval during the photostimulation session significantly decreased (right, n = 17 recording days, ****p<0.0001). (B) Examples of place fields from the nest, proximal, and distal cells during each session (the numerical value represents the peak firing rate). (C) Differences in the pixel-by-pixel spatial correlations (Z’) value (left, *p=0.039) and peak distances between the pre-stimulation and stimulation sessions (right, *p=0.019). (D) Spatial correlations (individual data: orange squares, regression line: dark red, r = −0.1320, *p=0.0359) and peak distances (individual data: blue circles, regression line: dark blue, r = 0.1625, **p=0.0096) of all place cells between pre-stimulation and stimulation sessions are plotted in the order of X position of rats. (E) Power spectral densities (PSD, shown as % of total PSD) of different frequency bands from each cell type during the three sessions. The dark lines and shaded bands represent the mean and SEM, respectively. The gray band represents the theta range (6–10 Hz), and the percentage of theta power during the three sessions is shown in the inserted bar graphs. (F–J) The same analyses as in (A–E), and data were collected from rats not exhibiting defensive behaviors to the photostimulations. (F) When the stimulation of the BA was too weak (left) to elicit defensive behaviors (middle), the success rates across the three sessions were not different (right, n = 6 recording days, p>0.999). (I) Spatial correlations: r = 0.0.09758, p=0.4430; peak distances r = 0.0.006948, p=0.9565. Data are presented as mean ± SEM.


