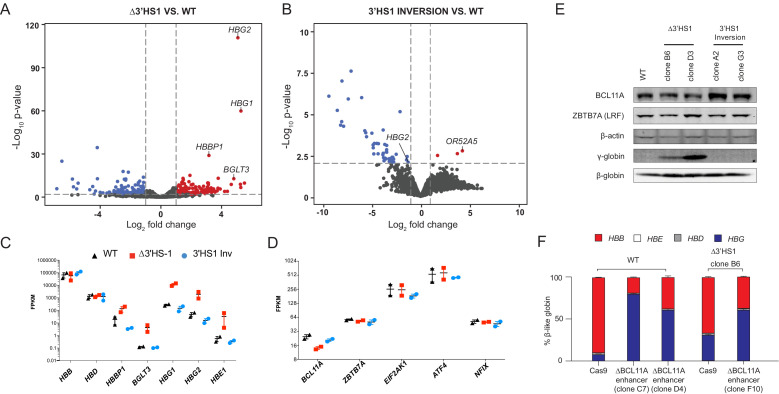
Figure 2. The induction of HbF in Δ3′HS1 cells is BCL11A independent.
(A) Volcano plot of differentially expressed genes in two Δ3′HS1 clones (B6 and D3) vs. two wild-type HUDEP-2 biological duplicates. Differentially expressed globin and olfactory receptor genes are labeled. (B) The volcano plot of differentially expressed genes in two 3′HS1 inversion clones (A2 and G3) vs. two wild-type HUDEP-2 biological duplicates. Differentially expressed globin and olfactory receptor genes are labeled. (C) Expression level of β-globin genes in Δ3′HS1 clones, 3′HS1 inversion clones, and wild-type HUDEP-2 cells. (D) Expression level of known fetal hemoglobin repressor genes in Δ3′HS1 clones, 3′HS1 inversion clones, and wild-type HUDEP-2 cells. (E) Western blot shows the level of BCL11A and ZBTB7A (LRF) in Δ3′HS1 clones, 3′HS1 inversion clones, Δ3′HS-5 clones, and wild-type HUDEP-2 cells. Refer to Figure 2—source data 1 for original blot picture. (F) The composition of β-like hemoglobin genes in the WT HDUEP-2 cells with BCL11A + 58 enhancer deleted with CRISPR/Cas9 and Δ3′HS1 HDUEP-2 cells with BCL11A + 58 enhancer deleted with CRISPR/Cas9.


