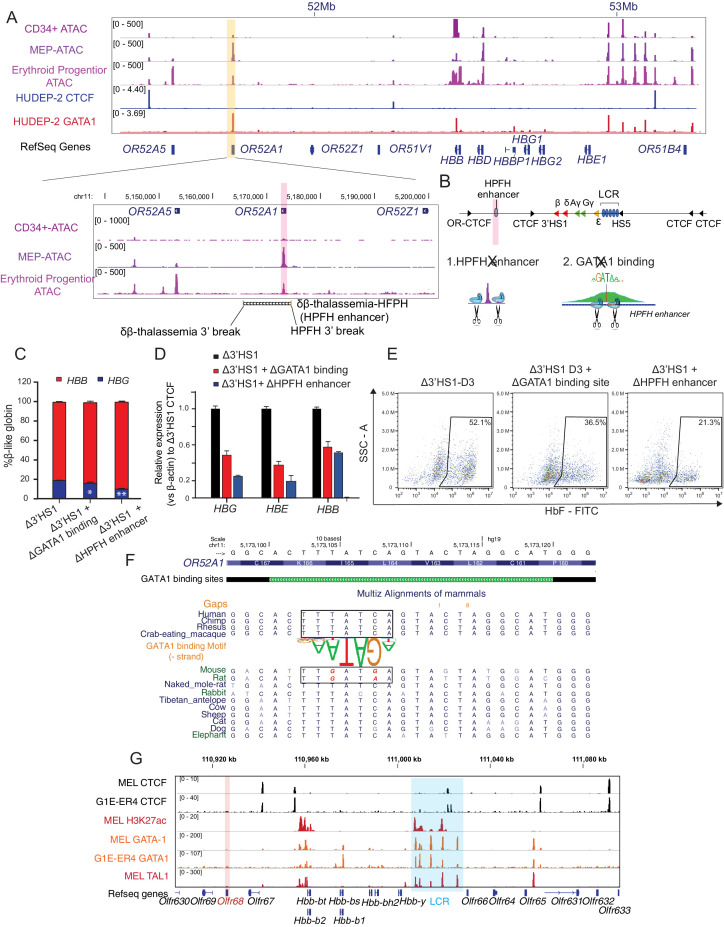
Figure 3. The induction of HbF in Δ3′HS1 cells is modulated by HPFH enhancer.
(A) Upper panel: IGV view of ATAC-seq in primary human blood cells followed by GATA1 and CTCF ChIP-seq in HUDEP-2 cells around the β-globin locus. Lower panel: ATAC-seq of CD34+ hematopoietic stem and progenitor cell (HSPC), megakaryocyte–erythroid progenitor (MEP), and erythroblast is shown in the zoomed view for the OR52A1 region. Red-shaded area indicates the locus of OR52A1. HPFH 3' beak and δβ-thalassemia 3' break is annotated (Feingold and Forget, 1989). (B) The experimental scheme of hereditary persistence of fetal hemoglobin (HPFH) deletion in the 3'HS1 deletion background. (C) The composition of β-like globin Δ3′HS1 (clone B6) HUDEP-2 cells with GATA1 binding site and HPFH region deletion. Mean ± SD is displayed, n = 3. (D) Relative expression of HBE, HBG (probe measures both HBG1 and HBG2), and HBB in the Δ3’HS1 (clone B6) HUDEP-2 cells with GATA1 binding site and HPFH enhancer region deletion. Mean ± SD is displayed, n = 3. (E) The representative HbF flow plot of Δ3’HS1 (clone B6) HUDEP-2 cells with GATA1 binding site and HPFH enhancer region deletion. (F) Evolution conservation of OR52A1 GATA1 binding site in vertebrates. GATA1 binding motif is shown in the middle. The site in mouse and rat associated with human GATA1 binding is boxed out. (G) Chromatin landscape of mouse β-globin gene cluster in mouse erythroid cells MEL and G1-ER4. CTCF, GATA1, and TAL1 ChIP-seq is shown. Orange stripe highlights the mouse homolog of human OR52A1–Olfr68.


