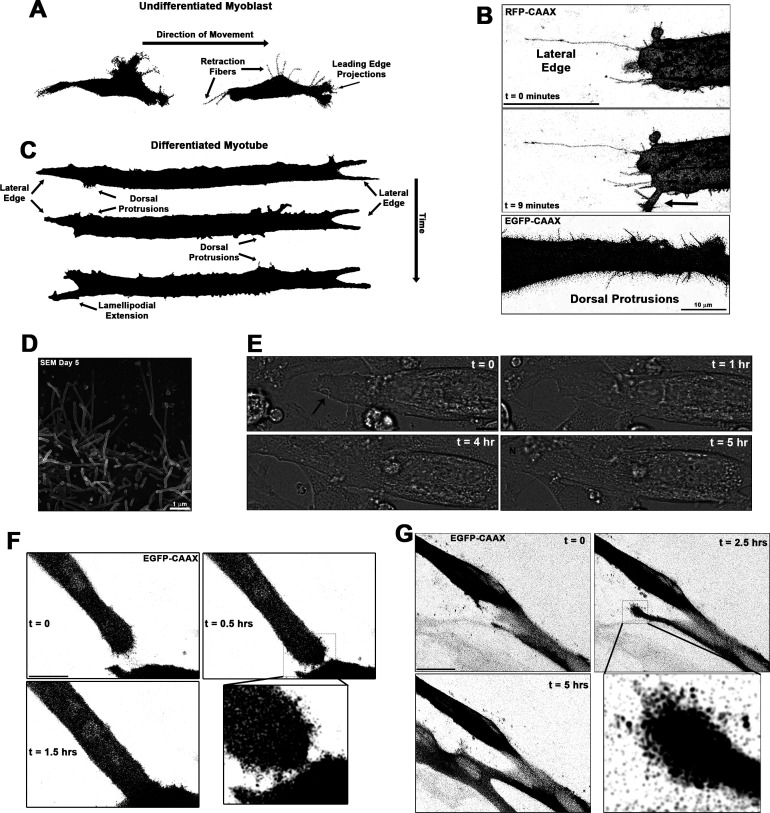
Figure 1. Cellular projections are prominent on differentiating muscle cells and participate in cell fusion.
(A) A summary schematic depicting the cellular protrusions exhibited by undifferentiated myoblasts. (B) Live-cell confocal microscopy of differentiated myotubes (day 5) expressing a membrane-targeted fluorescent protein constructs (RFP-CAAX or GFP-CAAX) reveals myogenic projections are dynamic structures featured across the cell surface, including prominent lateral edge projections, dorsal protrusions, and those emerging from lamellipodial extensions (indicated by arrow). (C) Summary schematic displaying cellular projections associated with differentiated myotubes. (D) Cellular projections visualized on the surface of differentiating myoblasts by scanning electron microscopy (SEM). (E) Differential interference contrast imaging of a myotube exhibiting lateral edge protrusions (indicated by arrow) actively engaged in myoblast fusion (N indicates newly incorporated nucleus; days 4–5). Fluorescently labeled myoblasts utilizing (F) lateral edge protrusions and (G) a lamellipodial extension adorned with fine protrusions to promote fusion with adjacent cells (differentiation days 4–5). EGFP-CAAX in (G) becomes transferred to the non-expressing cell upon fusion, making the newly added cell visible via fluorescence. Unless otherwise noted, scale bars represent 25 µm.


