(
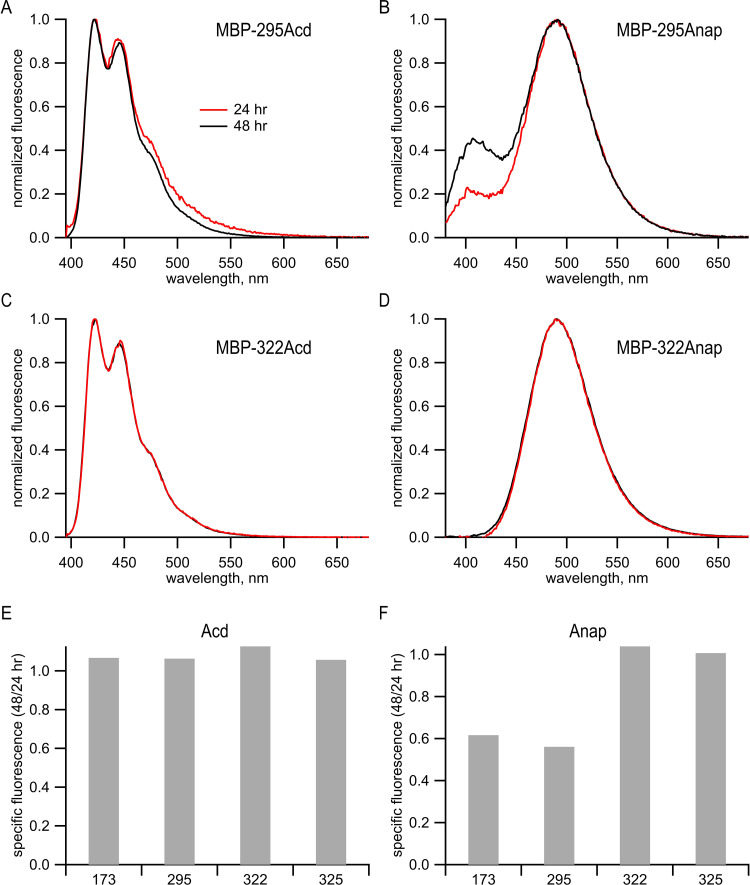
A–D) Emission spectra of purified protein recorded in 6 M guanidinium HCl in KBT for (
A) MBP-295Acd, (
B) MBP-295Anap, (
C) MBP-322Acd, and (
D) MBP-322Anap. For Acd, samples were excited at 385 nm, with 5 nm slits, and emission was recorded with 5 nm slits. For Anap, samples were excited at 350 nm with 5 nm slits and emission was recorded with 5 nm slits. Red traces represent samples harvested from cells 24 hr post-transfection, and black traces represent samples harvested from cells 48 hr post-transfection. (
E, F) Peak fluorescence intensities from fluorescence size exclusion chromatography for (
E) Acd or (
F) Anap were normalized to the peak tryptophan absorption at 280 nm of the same protein in the same fluorescence size-exclusion chromatography run (see
Figure 2G,H). Data from cells harvested at 48 hr post-transfection were normalized to the data from cells harvested at 24 hr post-transfection. The numbers under each bar represent the position of the TAG stop codon into which Acd or Anap were incorporated. It should be noted that no truncated protein was observed in the tryptophan absorption channel (see
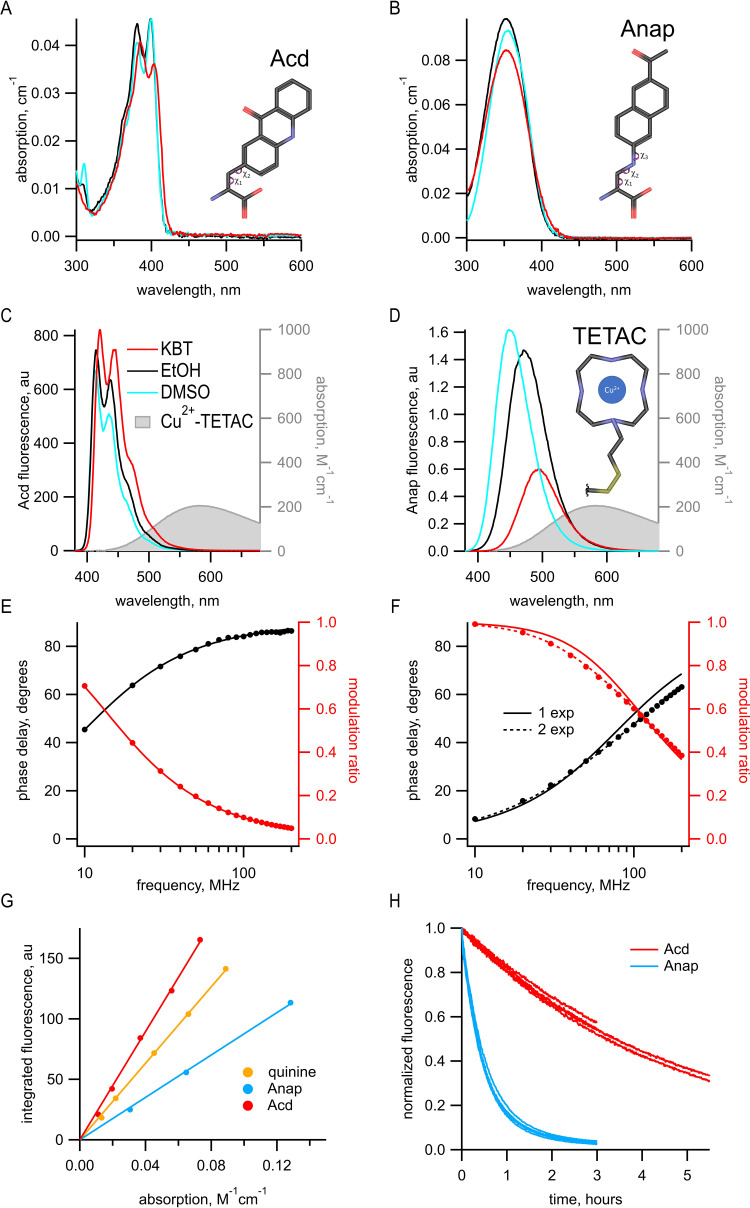
Figure 2H). Our interpretation of these data is discussed below. Analysis of the emission spectra of Acd and Anap incorporated into MBP revealed a problem with some Anap-containing proteins that were not present in Acd-containing proteins. MBP constructs containing either Acd or Anap were expressed and purified as described in Materials and methods. The Acd emission spectra of MBP-295Acd and MBP-322Acd in denaturing solution (6 M guanidine HCl) were very similar to the emission spectrum of free Acd (
Figure 1A,C). However, the emission spectrum of MBP-295Anap in denaturing solution was very different from that of free Anap (compare
Figure 1B,D). Whereas the emission of free Anap exhibits a single peak at 495 nm in aqueous solution, the emission of MBP-295Anap exhibits two peaks, one at 495 nm and the other at 405 nm. Furthermore, the proportion of the 405 nm peak increased with time in culture between 24 and 48 hr. (
B). The altered emission spectrum persisted after protein purification and remained stable. The finding that the emission spectrum was altered even in denaturing solution and changed over the course of days in culture suggests that it was not simply due to a change in the local environment of Anap in MBP-295Anap, but due to a chemical change of the fluorophore. To further explore the nature of the problem with Anap incorporated into MBP, we determined the emission spectrum and specific fluorescence of Anap introduced into multiple sites of MBP. Unlike MBP-295Anap, MBP-322Anap had an emission spectrum in denaturing solution that was very similar to that of free Anap and was not affected by time in culture (
D). For two of the four MBP sites we tested, the specific fluorescence of Anap decreased dramatically between 24 and 48 hr in culture (
F). No decrease was observed for Acd incorporated into MBP at the same positions (
E). Therefore, it appears that, for some Anap-containing proteins, Anap underwent a chemical change inside the cell that dramatically decreased it brightness. This is a problem not seen with Acd constructs.


