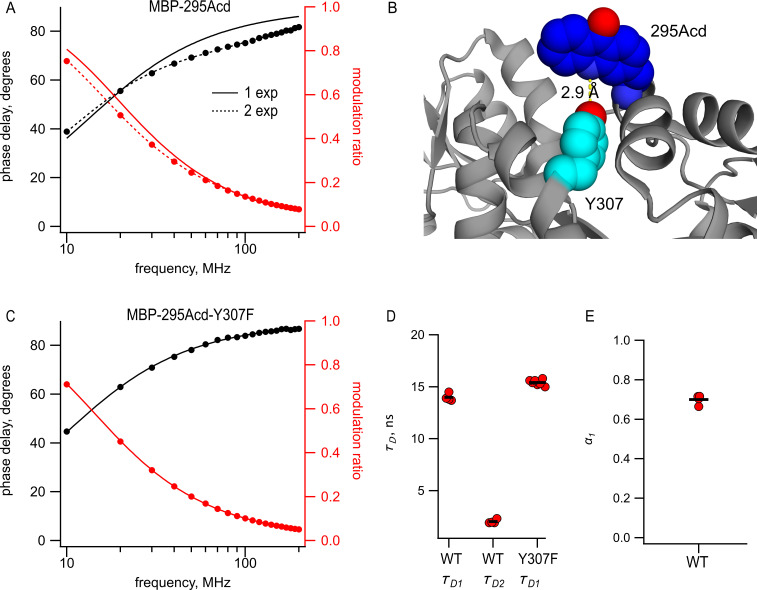
Figure 5. Acd in MBP-295Acd is nonexponential and introduction of the Y307F mutation increases its lifetime and makes it single exponential.
(A, C) Frequency-domain measurements of fluorescence lifetime of (A) MBP-295Acd and (C) MBP-295Acd-Y307F. Black, phase delay in degrees; red, modulation ratio. Curves are fits with Equations 5 and 6 corrected by Equations 13 and 14. Fit parameters for (A) are = 11.6 ns for a single exponential (solid curve) and = 13.9 ns, = 1.9 ns, and α1 = 0.70 Å (dashed curve) and for (C) are = 15.6 ns. (B) Cartoon representation of the proximity between Acd at position 295 and tyrosine at position 307 in the apo state. (D, E) Collected data from fits for MBP-295Acd (WT) and MBP-295Acd-Y307F, as indicated. Independent samples are shown as red circles, and the means are shown as black lines.


