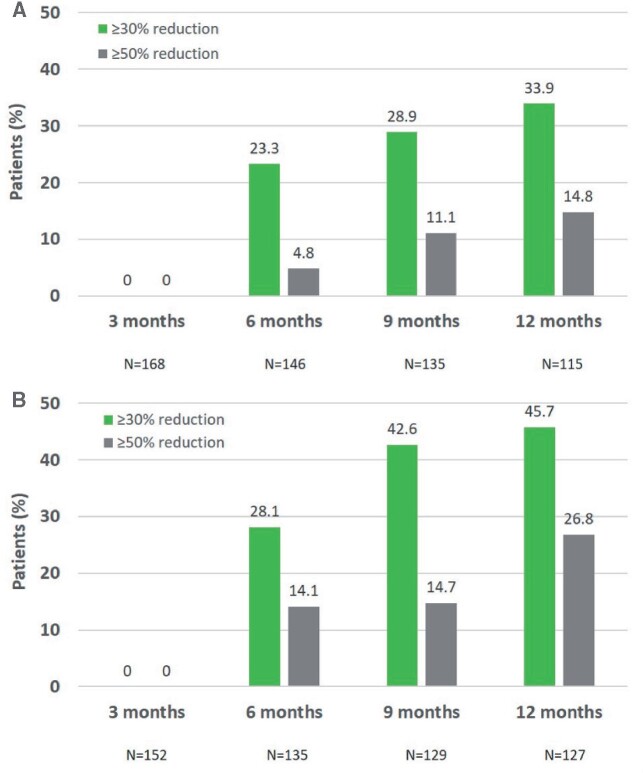
Figure 2.
(A) Rates of responders among initial nonresponders in STRIDE. (B) Rates of responders among initial nonresponders in PACE. The figure shows the proportion of patients who went on to achieve a ≥30% or ≥50% reduction in pain intensity (assessed with question 5 of the BPI) after having failed to achieve a ≥30% response at 3 months.

