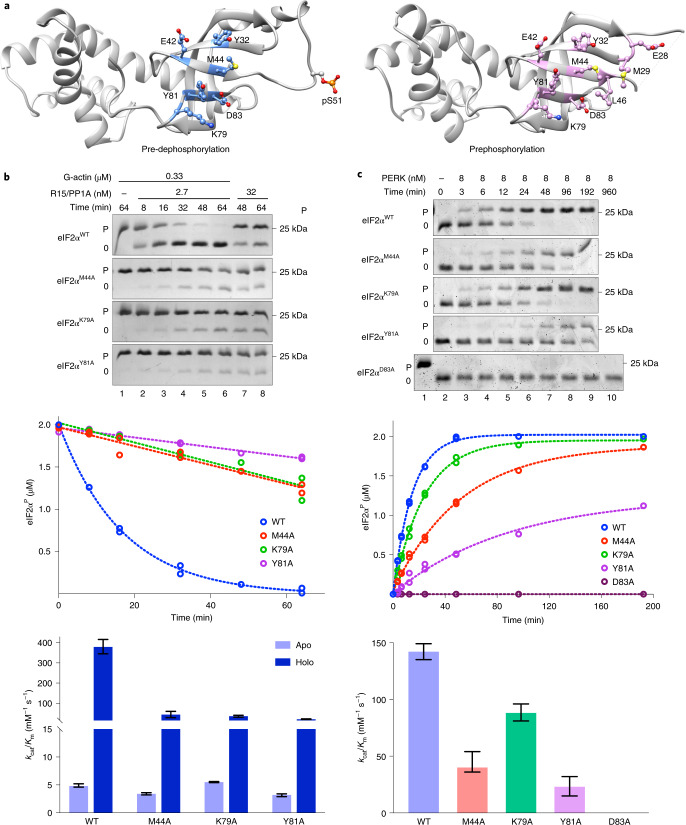
Fig. 6. Enzyme-facing substrate mutations interfere with eIF2αP dephosphorylation.
a, Ribbon diagram of eIF2α from the pre-dephosphorylation complex (this study, left) and a pre-phosphorylation complex with PKR (PDB 2A19, right). Residues contacting the respective enzymes are highlighted. pSer51, shown on the right, was unresolved in PDB 2A19. b, Coomassie-stained PhosTag gels of wild type and the indicated eIF2αP mutants (at 2 µM), following dephosphorylation in vitro with PPP1R15A holophosphatases (upper panel). Time-dependent progression of the dephosphorylation reactions above. The dotted line is fit to a first-order decay (of replicates) (middle panel). Best fit of three independent experiments in the ‘upper panel’ ±95% confidence intervals of the kcat/Km of the indicated enzyme/substrate pairing in reactions lacking (apo) and containing (holo) G-actin (lower panel). Shown are representative example of experiments reproduced at least three times. c, As in b but reporting on the phosphorylation of the wild type and the indicated eIF2α0 mutants (at 2 µM) by the indicated concentration of the kinase PERK. Source data for b and c are available online.

