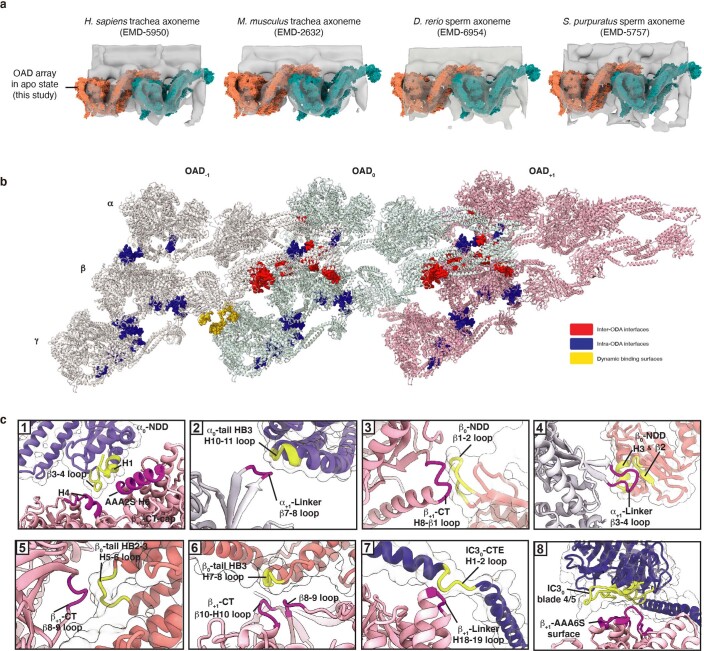
Extended Data Fig. 7. The conserved TTH interactions in motile cilia across species for array formation.
(a) The atomic model of our OAD array (γ-HC removed) fits well into previously reported cryo-ET maps of axoneme structures from four different organisms [human (Homo. sapiens), mouse (Mus. musculus), zebra fish (Danio. rerio), and sea urchin (Strongylocentrotus. purpuratus)]12,13,40,74, whose OADs contain homologues of α- and β-heavy chains. (b) The top-view structure of the array networks formed by intra- (blue) and inter-OAD (red, yellow) interactions. (c) Enlarged views of the eight main TTH interaction sites. The regions of OAD0 and OAD + 1 involved in interactions are marked in yellow and purple, respectively.

