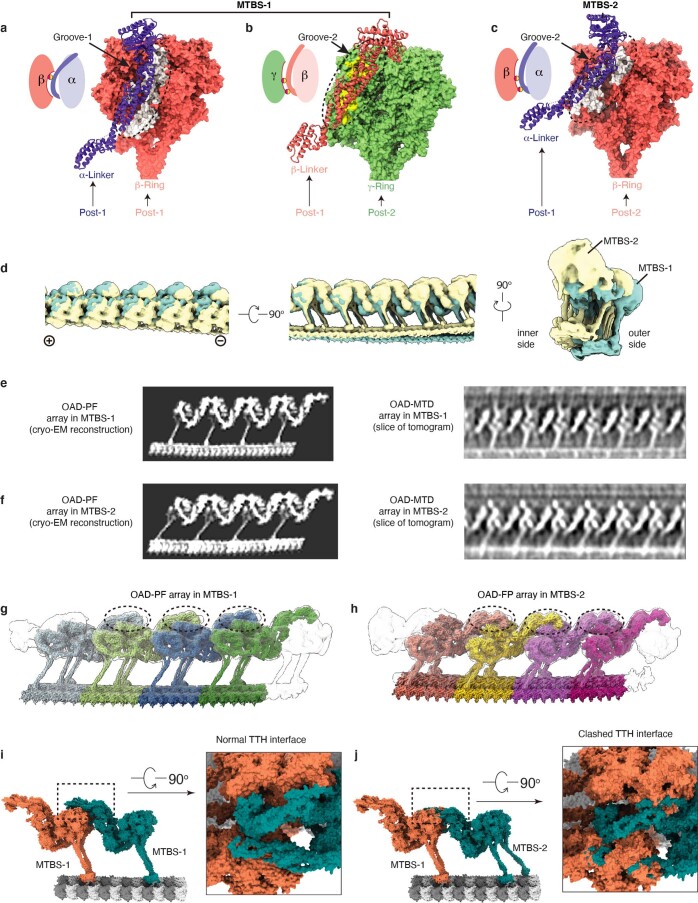
Extended Data Fig. 9. A comparison between OAD-PF structures in MTBS-1 and MTBS-2.
(a-c) The α-Linker moves its docking site on β-Ring from Groove-1 in MTBS-1 (a) to Groove-2 in MTBS-2 (c), which is consistent with the groove where β-Linker docks on γ-Ring in MTBS-1 (b). (d) A comparison between OAD-PF arrays in MTBS-1and MTBS-2 from three different views. Each array is generated by elongating the identical 48-nm OAD-PF maps in the same MTBS. (e-f) Cryo-EM reconstruction of the reconstituted OAD arrays (left) and the corresponding states from our cryo-ET analysis (right). The slices are focused on β-HC to show the key difference between MTBS-1 (e) and MTBS-2 (f). The single particle reconstructions were generated by joining two identical 48-nm OAD-PF maps. The cryo-ET maps were generated by sub-volume averaging from two representative tomograms. (g-h) The OAD arrays in MTBS-1 and MTBS-2 are assembled in the same TTH manner. The TTH interfaces are marked by the dashed black circles. (i-j) Substituting one OAD unit in MTBS-1 (i) with a unit in MTBS-2 (j) severely disrupts the interactions between the IC-NDD0 and the α/β+1-LR region (j, right).

