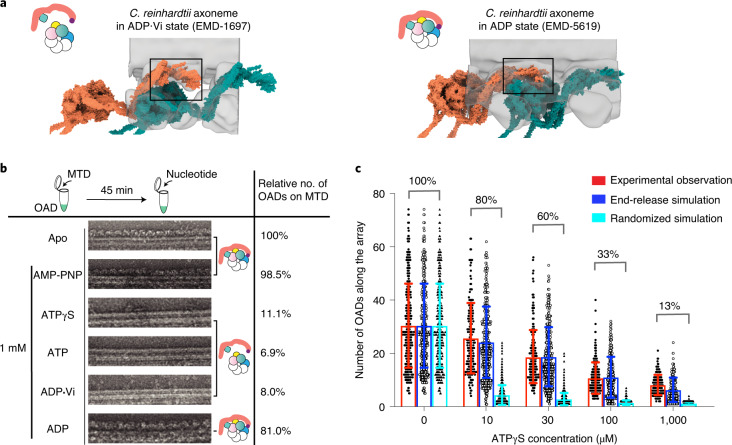
Fig. 6. Changes of TTH interfaces deliver the allosteric signal for motor coordination.
a, Different conformations of OAD array during the ATP cycle. The models (tomato and teal surfaces) were built based on previously reported cryo-ET maps11,17 (transparent gray) and our OAD coordinates. The TTH interfaces in different nucleotide states are highlighted in the black squares, each illustrated with a cartoon model. b, The effects of different nucleotides on the reconstituted OAD-MTD arrays in vitro. ATPγS, ATP and ADP·Vi disrupt almost all arrays, but AMP-PNP and ADP do not. The models illustrate how different nucleotides affect the TTH interfaces. Total OAD unit number of all arrays in the apo state was used as a reference and normalized as 100% for subsequent comparison. The percentages represent the relative OAD coverage (including individually bound OADs) on MTDs in different nucleotide conditions compared to the apo state. c, The effects of ATPγS on the length of OAD array at different concentrations. OAD number on each continuous array from negative-stain images was manually counted and showed as a single black dot (left) at ATPγS concentrations of 0 μM (n = 319 microtubules), 10 μM (n = 180), 30 μM (n = 214), 100 μM (n = 222), 1,000 μM (n = 159). Error bar represents s.d. Gray circles (middle) and black triangles (right) in each column represent computationally simulated distribution of the array lengths by end-release (middle) or stochastic disruption (right) of OADs from the arrays to the same coverage ratio as that of the experimental observation. The start of both simulations is identical to that of the experimental data (0 μM ATPγS). Source data for c are available online.

