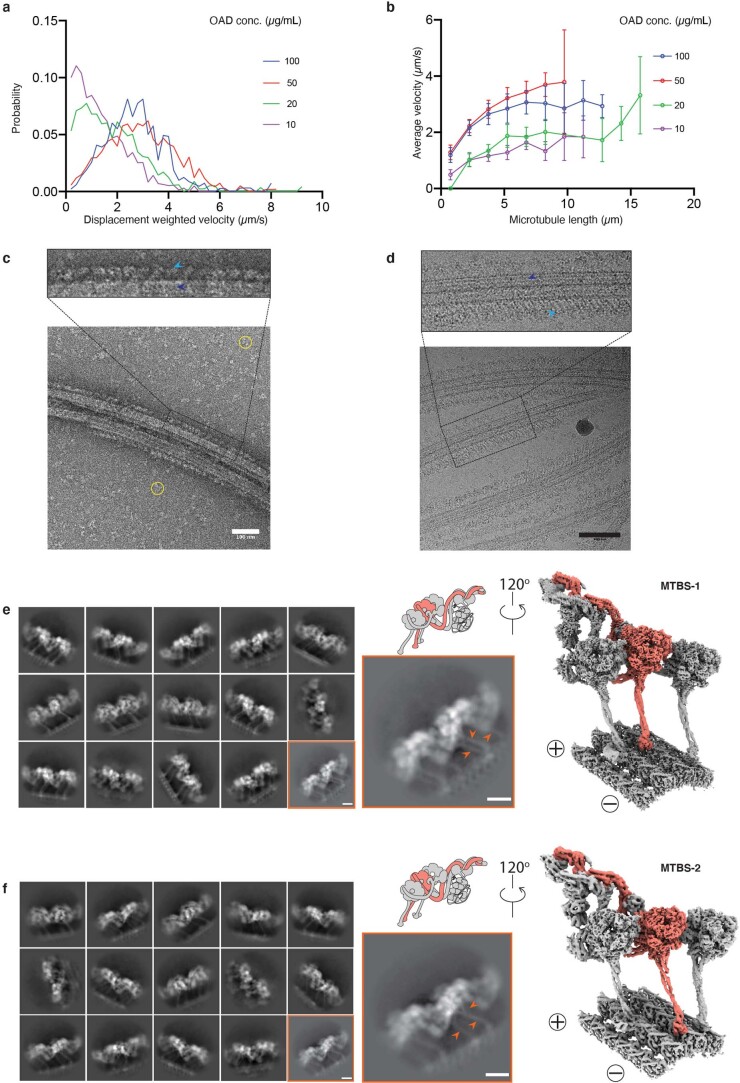
Extended Data Fig. 1. Biochemical characterization and structure determination of OAD-MTD array.
(a-b) The gliding velocity of the free OAD on different lengths of microtubule. (c-d) The representative negative−stain (c) and cryo-EM (d) micrograph of the reconstituted OAD-MTD sample show that the highly ordered OAD arrays with 24-nm periodicity are formed in the absence of nucleotides and docking complex, in line with previous findings16. The OAD arrays and MTDs are indicated by sky blue and blue arrows (upper), respectively. The excessive free OADs are marked by yellow circles in the background (before centrifugation). Similar images could be regularly acquired from n > 5 independent reconstitution assays. Scale bar, 100 nm. (e-f) The OAD arrays decorate MTD in two microtubule-binding states (MTBS-1 and MTBS-2). Representative 2D classes (left) and cryo-EM maps of the OAD-PF unit (right) in MTBS-1 (e) and MTBS-2 (f). The arrows indicate differences of the stalk orientations in MTBS-1 and MTBS-2 (e, f, lower middle).

