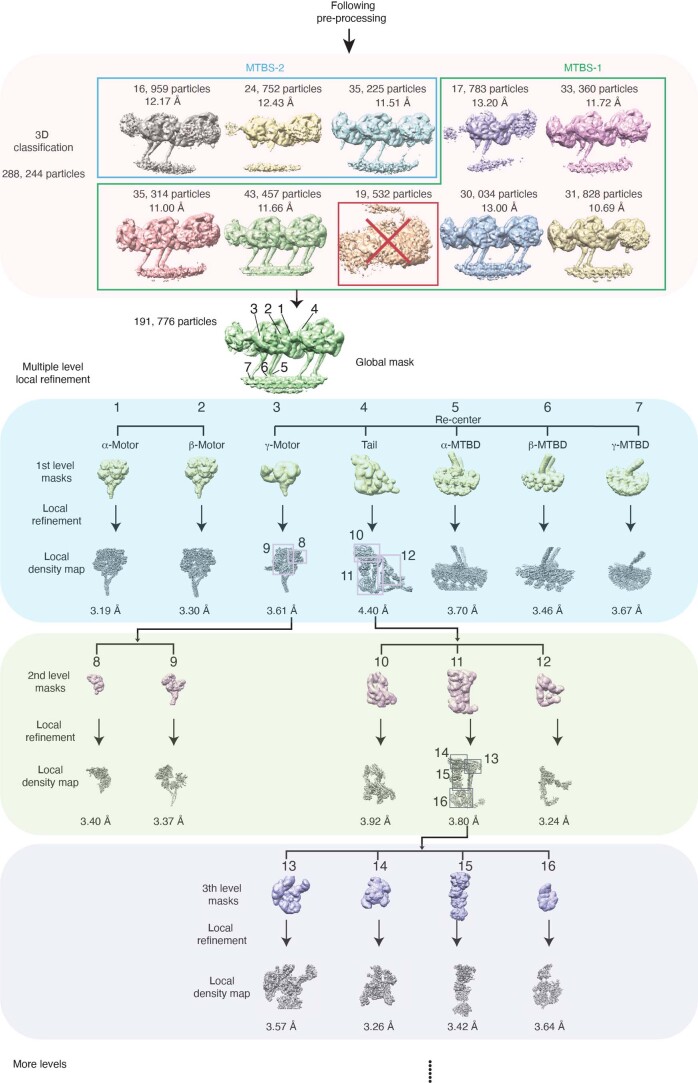
Extended Data Fig. 2. Flow chart of the OAD structure determination.
The 3D classification identified two major microtubule-binding states (MTBS-1 and MTBS-2). The six good classes enclosed in the green rectangle are categorized into MTBS-1. The class in the red square was removed from the dataset for all following data processing. Three classes enclosed in sky blue rectangle are categorized into MTBS-2. Multiple levels of masks were implemented in the local refinement to improve the resolution of OAD-PF structure. The box size (~680 nm) was optimized to cover at least two adjacent OADs and the four PFs they bind to. The attached images represent typical local densities of the 3D volumes generated from cryoSPARC 2.12.

