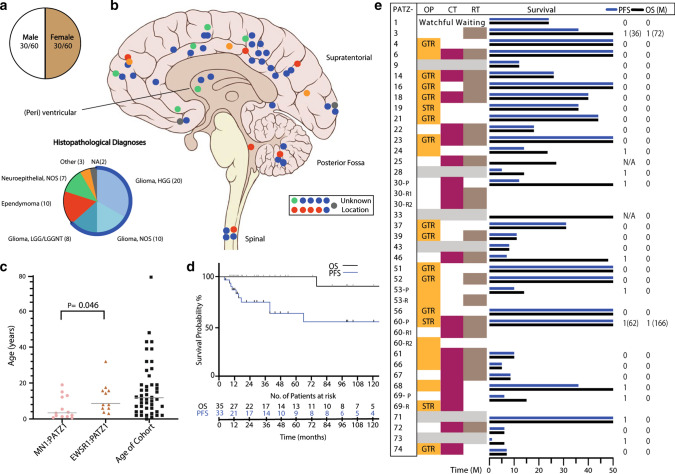
Fig. 5.
Clinical features of NET-PATZ1. a Patient sex distribution. b Distribution of tumor location. The institutional histopathological diagnoses of the series are also shown, representing a broad spectrum of mostly glial diagnoses. c Age distribution with the horizontal line representing median age of our cohort (11 years). MN1:PATZ1-fused tumors appear to be significantly enriched in younger ages (median = 3.5 years) vs EWSR1:PATZ1 (median = 8 years), (p value; 0.046, Student’s t test). d Clinical outcome in terms of OS and PFS of NET-PATZ1. e Overview of the different therapy protocols NET_PATZ1 patients within this cohort received. Where highlighted, the patients received that particular therapy modality, grey bars indicate unknown data. Different management as per primary vs relapse tumor is also shown. Note that some patients benefited from surgery (OP) alone. CT chemotherapy, RT radiation therapy, P primary, R (1/2) relapse 1 or relapse 2, GTR gross total resection, STR subtotal resection, 1 relapse/death, 0 censored. Detailed therapy protocols are listed in Supplementary Table 1, online resource

