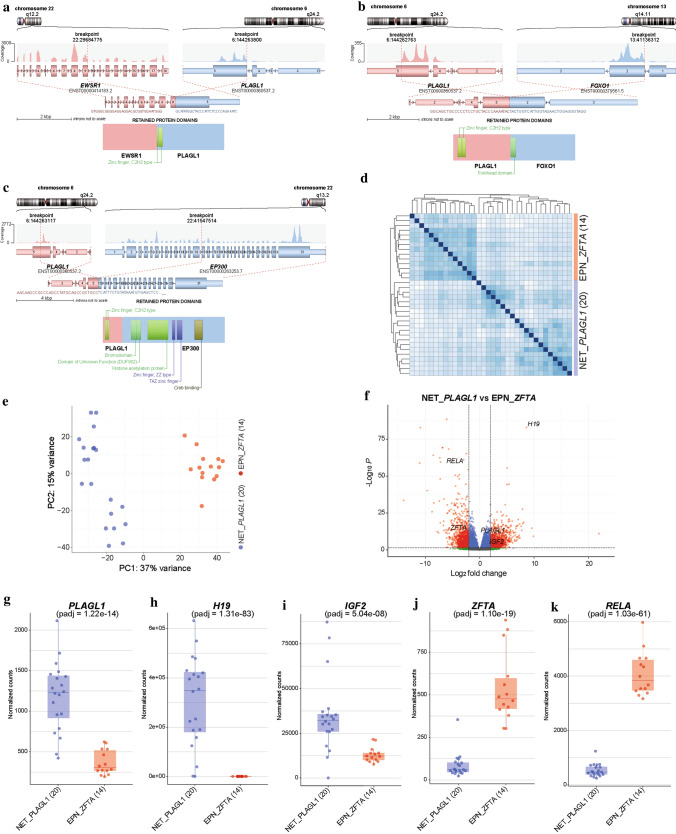
Fig. 2.
Illustration of the PLAGL1 fusion genes and transcriptional profiling of tumors samples in the novel group (NET_PLAGL1). Visualization of the PLAGL1 fusion genes detected by RNA sequencing for three selected samples. EWSR1:PLAGL1 fusion in case #1, in which exons 1–9 of EWSR1, as the 5’ partner, are fused to exon 5 of PLAGL1 (a), PLAGL1:FOXO1 fusion in case #18, in which exons 1–5 of PLAGL1 are fused to exons 2–3 of FOXO1 as the 3’ partner (b), and PLAGL1:EP300 fusion in case #19, in which exons 1–5 of PLAGL1 are fused to exons 15–31 of EP300 as the 3’ partner (c), conserving the zinc finger structure (C2H2 type) as part of the fusion products. Differences in gene expression profiles between samples in the novel group and ZFTA:RELA-fused ependymomas. Normalized transcript counts from samples in the novel group and ZFTA:RELA-fused ependymomas clustered by Pearson’s correlation coefficient (d) and principal component analysis (e). Volcano plot depicting genes differentially expressed between samples in the novel group versus ZFTA:RELA-fused ependymomas (f). PLAGL1 (g), H19 (h), IGF2 (i), ZFTA (j), and RELA (k) expression in the novel group (n = 20) compared to ZFTA:RELA-fused ependymoma samples (n = 14)

