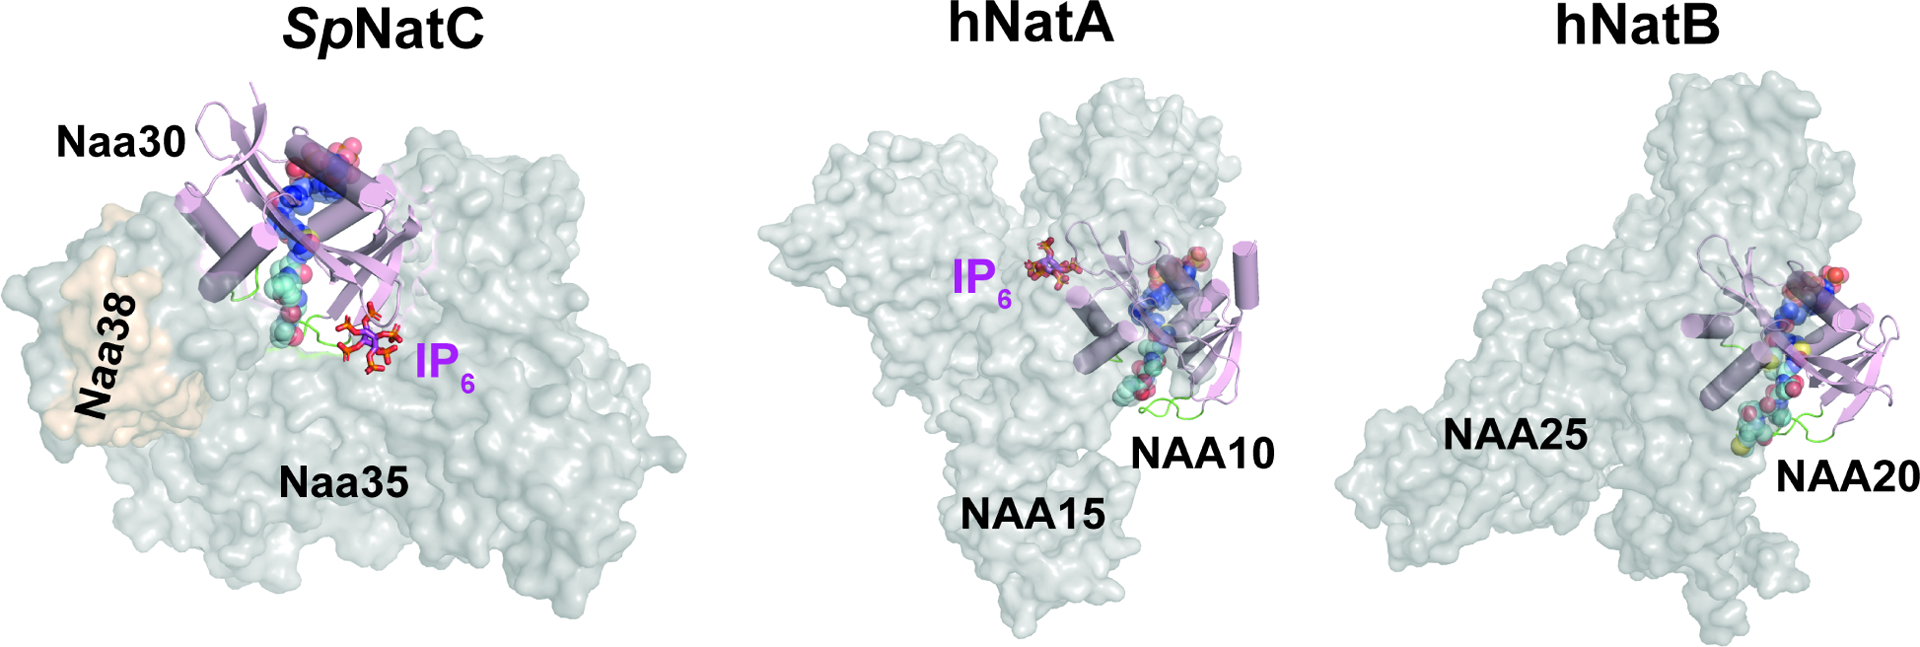
Figure 3. Comparison of NatC with NatA and NatB reveals divergent NatC architecture.

The auxiliary subunits are shown as transparent surface in grey or brown, while the catalytic subunits are shown as cartoon in light pink (catalytic subunits are aligned in the same orientation). The blue spheres, cyan spheres, and magenta sticks represent Ac-CoA, peptide substrate, and IP6, respectively. The highlighted green loops shown are α1-α2 and β6-β7 substrate binding loops of the catalytic subunits. The PDB models for generating this figure: HsNatA with IP6, PDB: 6C9M (the bisubstrate analogue shown is aligned from SpNatA, PDB:4KVM); HsNatB with the bisubstrate analogue, PDB: 6VP9; model of SpNatC with the bisubstrate analogue and IP6, PDB: 7L1K. As NatE is a complex with dual catalytic subunits and shares the same auxiliary subunit with NatA, for simplicity, it is not compared in this figure.
