
Figure 2. Risk of COVID-19 according to community transmission rate and diet quality.
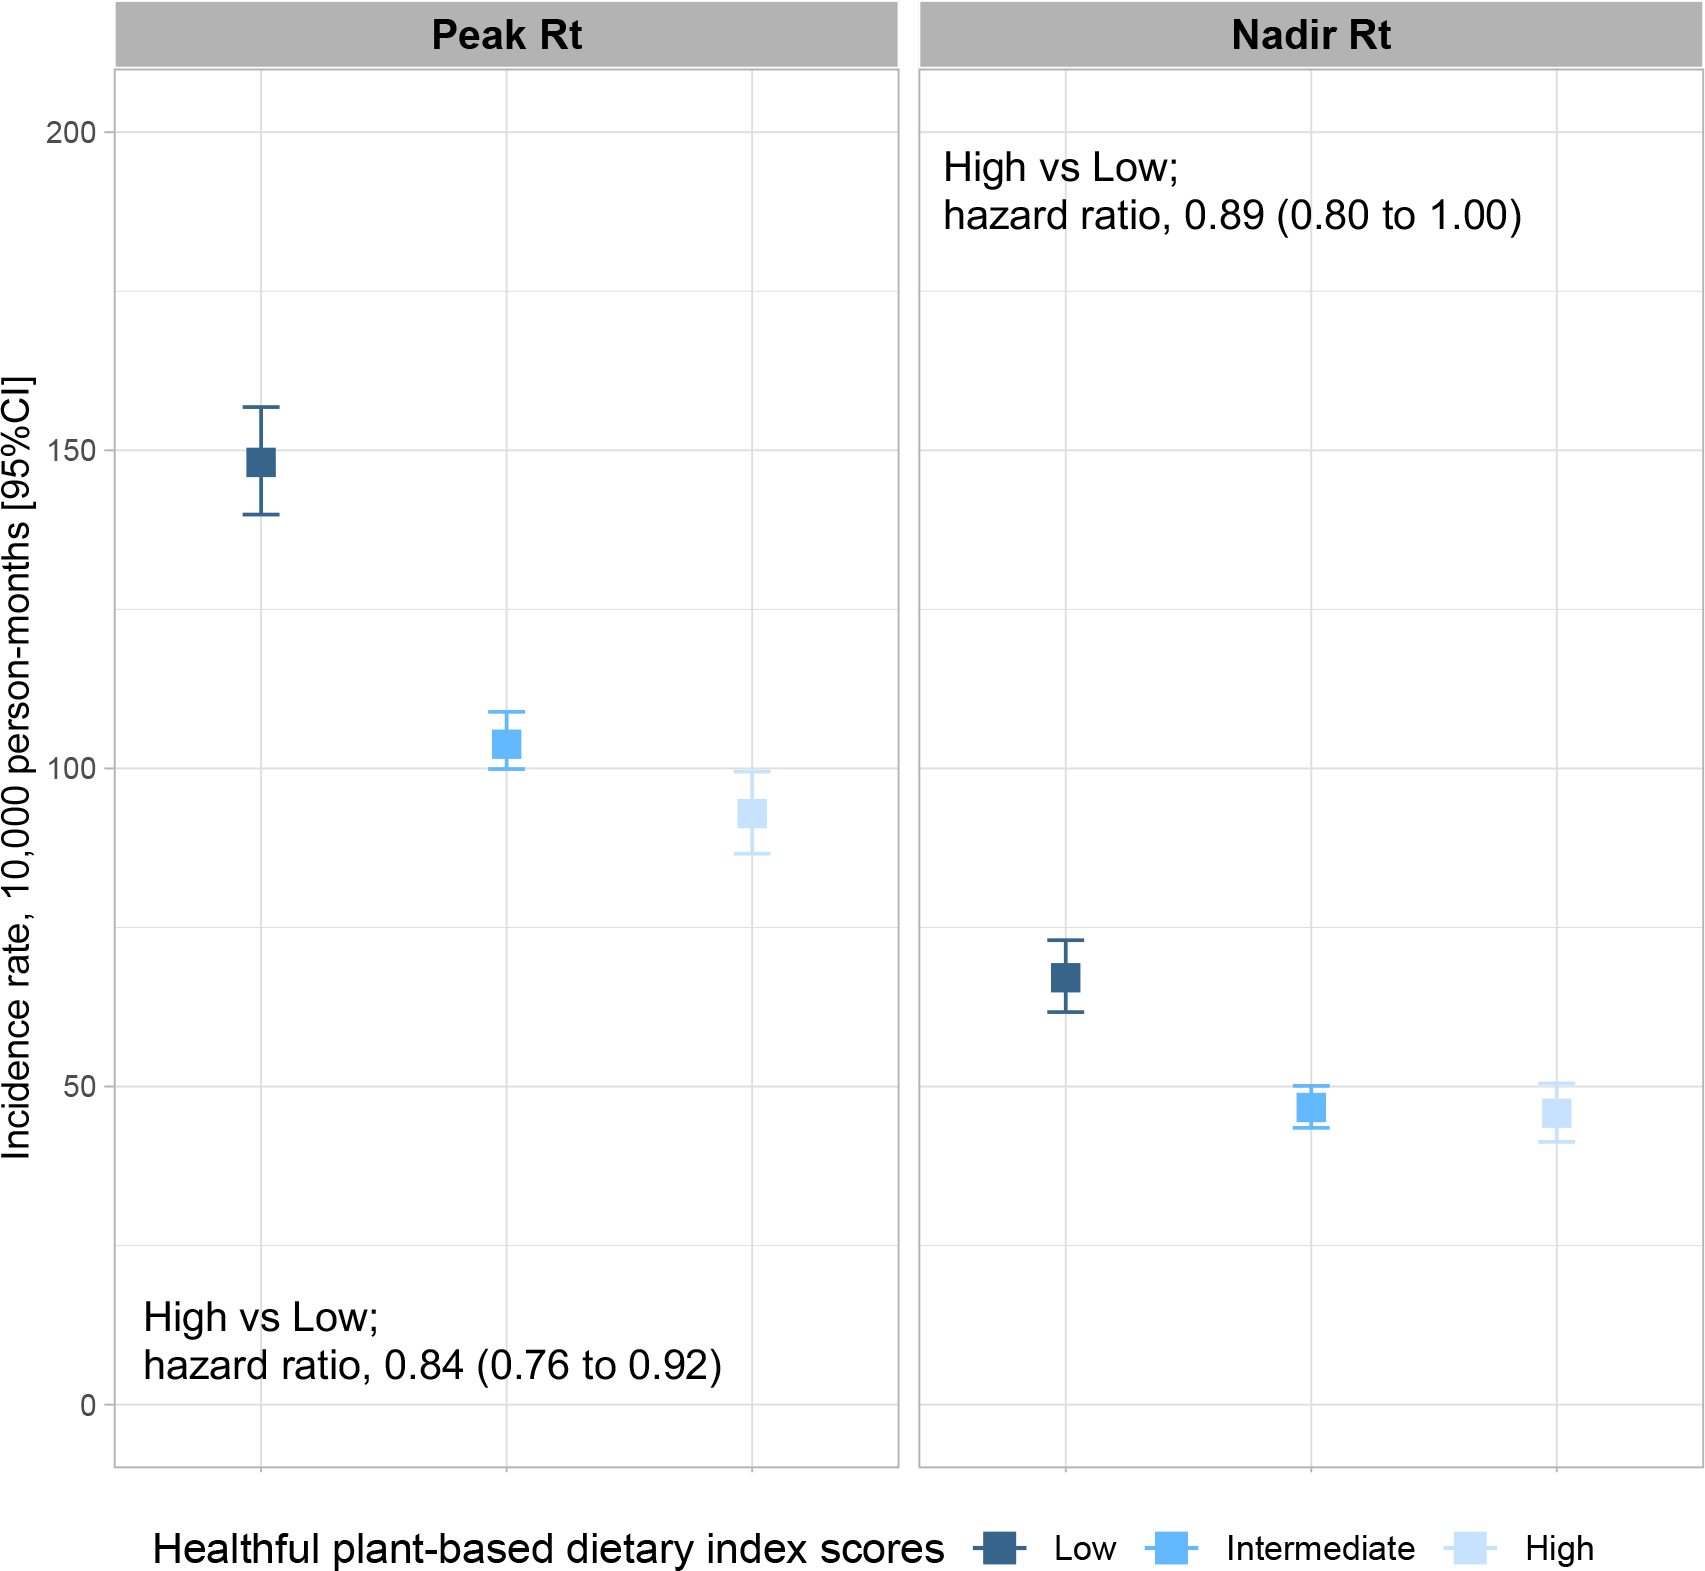
COVID-19 incidence rate per 10,000 person-month and 95% confidence interval of the estimate based on different community transmission rate and diet quality categories. Peak Rt and nadir Rt were defined using (methods). Adjusted hazard ratios and 95% confidence interval of the estimate for risk of COVID-19 were obtained from fully adjusted Cox models.