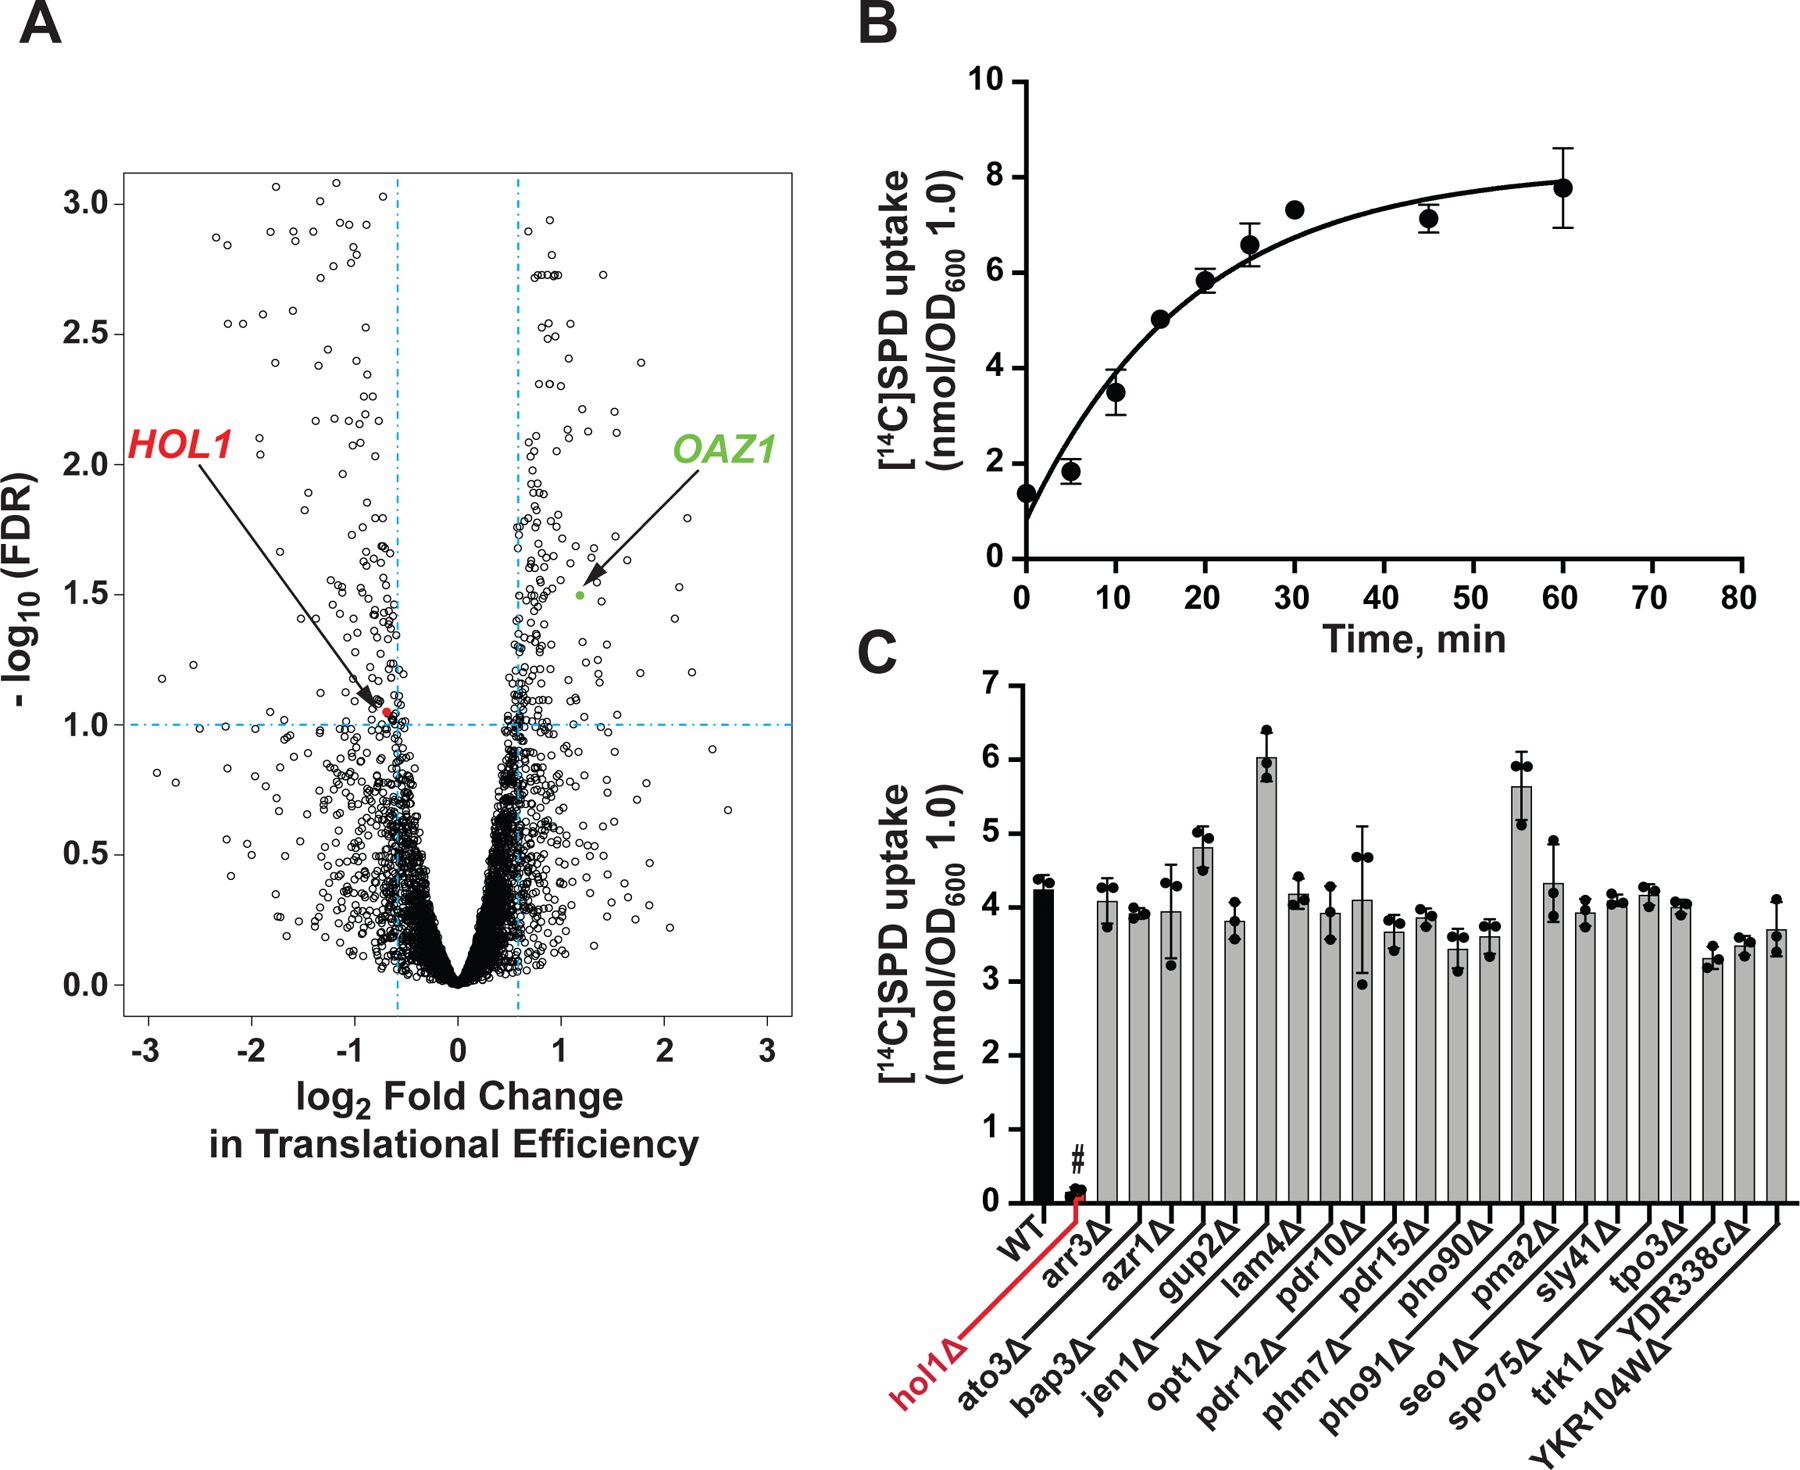
Figure 1. Translational Profiling and Uptake Assays Link Hol1 to Polyamine Transport.

(A) Volcano plot showing translational efficiency (TE) changes versus FDR in spe1 spe2 mutant yeast strain Y362 grown in low (0 μM) and high (10 μM) SPD. Vertical dashed lines denote 1.5-fold changes in TE; horizontal dashed line denotes FDR = 0.1; translationally upregulated antizyme (OAZ1; green) and downregulated HOL1 (red) mRNAs are highlighted.
(B) Time-course of [14C]SPD uptake by log-phase WT BY4741 cells was fit to a single exponential curve. Error bars represent SD (n = 3).
(C) [14C]SPD uptake at 20 min in derivatives of BY4741 lacking the indicated gene encoding a TE-downregulated transmembrane transport-related protein. Error bars denote SD; #p < 10−5 relative to WT (Student’s two-tailed t test; n = 3).
