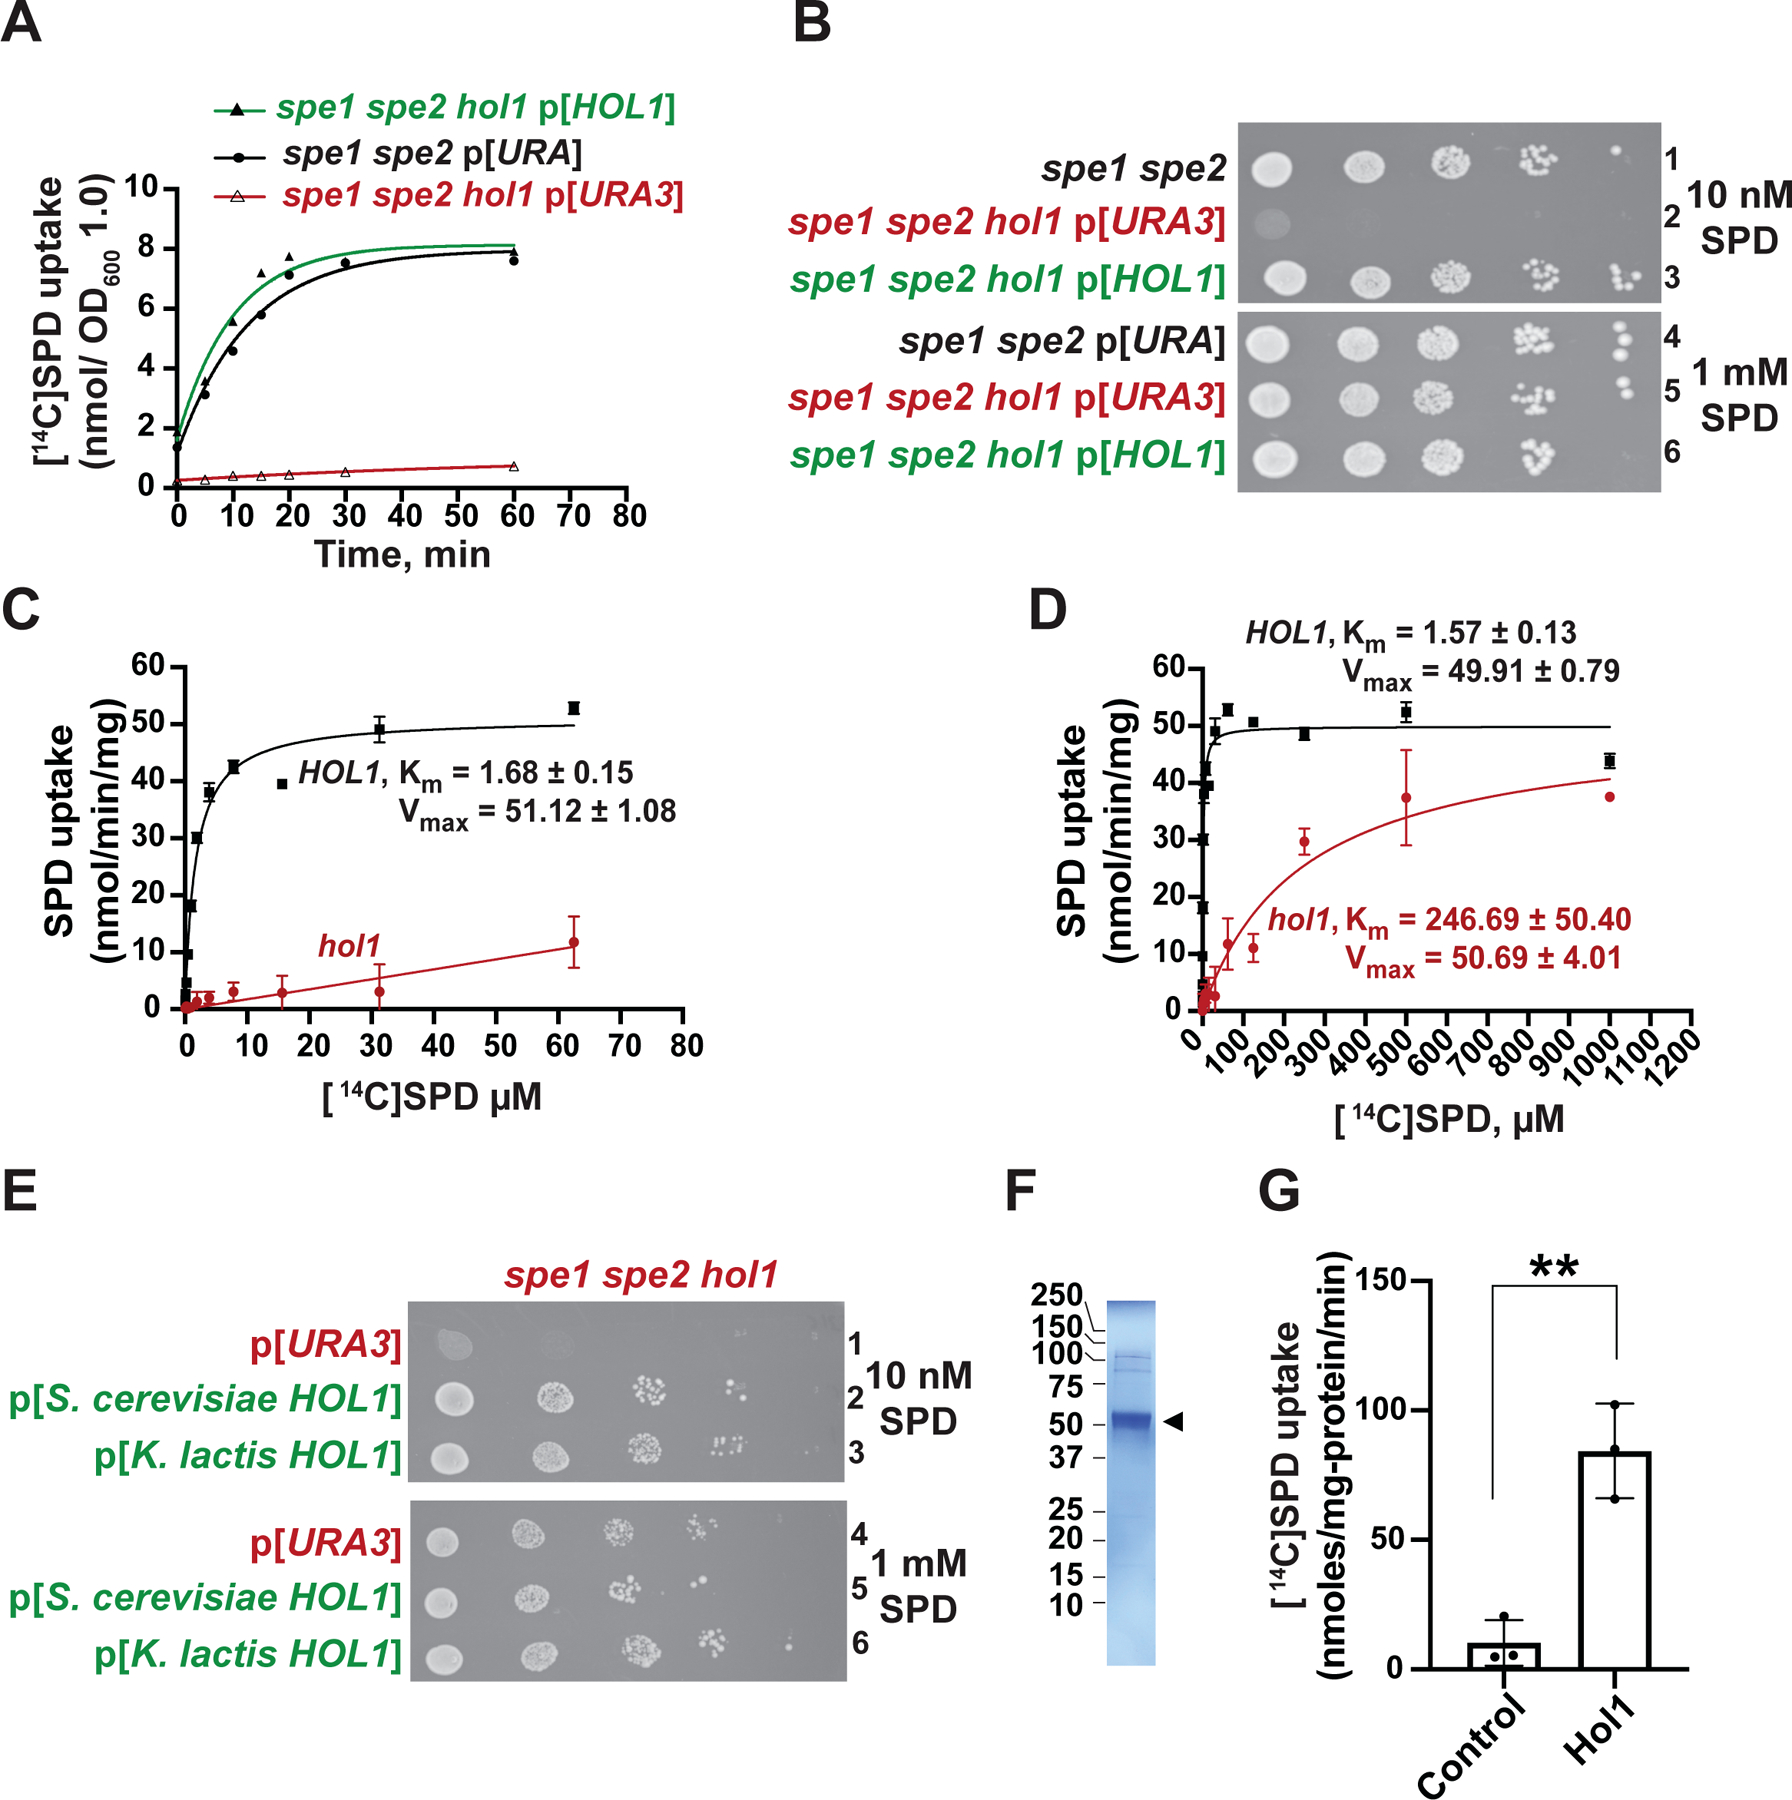
Figure 2. Hol1 is the Major High-affinity Polyamine Transporter in S. cerevisiae.

(A–B) The spe1 spe2 yeast strain Y362 carrying an empty vector (black) and the isogenic spe1 spe2 hol1 strain J1570 carrying empty vector YCplac33 (red) or HOL1 plasmid pC6464 (green) were tested (A) for [14C]SPD uptake and (B) for growth using spotting assays on SD plates containing low (10 nM, upper panel) or high (1 mM, lower panel) SPD. In (A), results were fit to a single exponential curve; error bars denote SD; n = 3.
(C–D) Rate of [14C]SPD uptake (nmol/min/mg protein) at the indicated SPD concentrations in spe1 spe2 hol1 strain J1570 carrying empty vector YCplac33 or HOL1 plasmid pC6464, as indicated, were fit to the Michaelis-Menten equation to calculate the Km (μM) and Vmax (nmol/min/mg) for uptake in the presence and absence of HOL1 (n = 3). Note the different SPD concentration ranges in the panels.
(E) Derivatives of the spe1 spe2 hol1 strain J1570 carrying empty vector pC6316 or a plasmid expressing S. cerevisiae (pC6455) or K. lactis (pC6639) HOL1 under the control of a weak constitutive promoter derived from the yeast HSF1 gene were tested for growth using spotting assays on SD plates containing low (10 nM, upper panel) or high (1 mM, lower panel) SPD.
(F) SDS-PAGE gel of detergent purified K. lactis Hol1 (arrowhead).
(G) [14C]SPD uptake by control or K. lactis Hol1 proteoliposomes; error bars denote SD, **p < 0.01 (Student’s two-tailed t test; n = 3).
