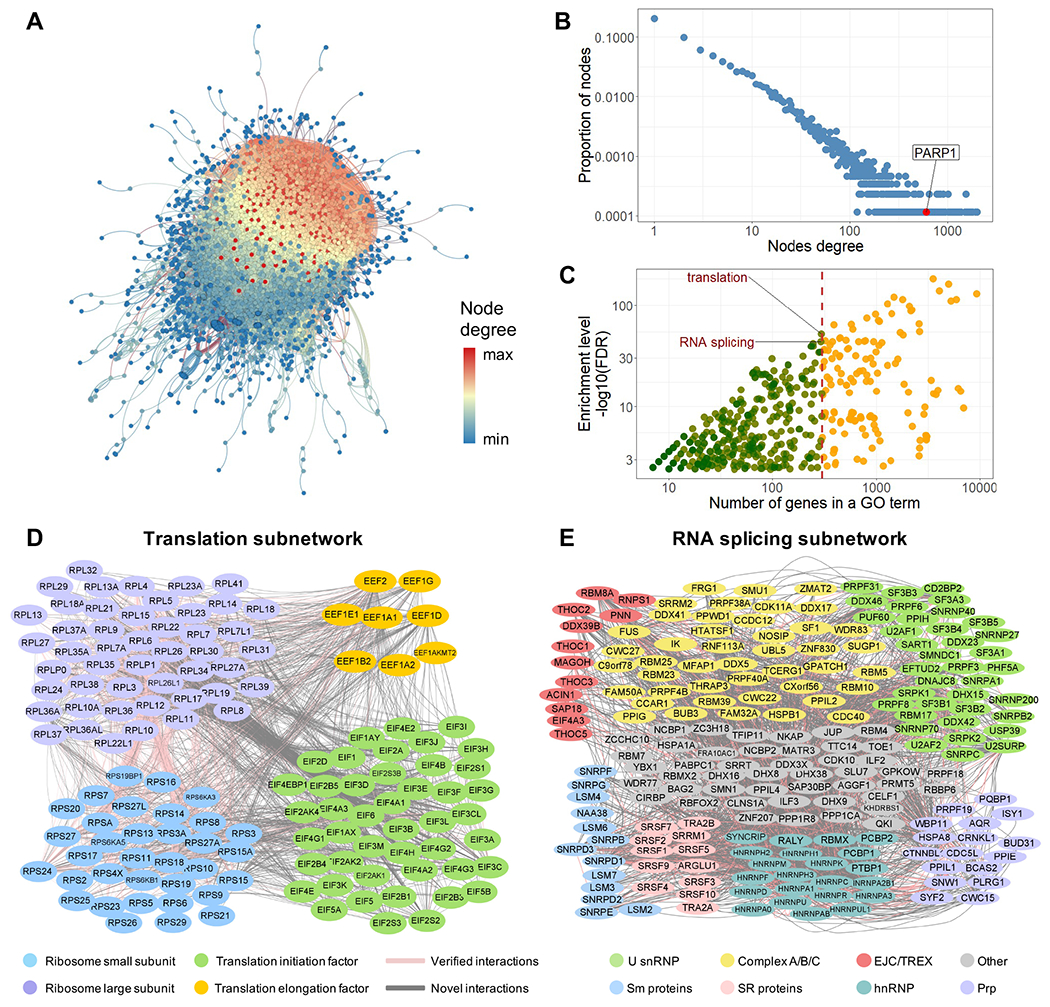
Figure 4.

PROPER v.1.0. (A) The entire PROPER v.1.0 network with proteins as nodes and PPIs as edges. The degree of nodes is color-coded from high (red) to low (blue). (B) PROPER’S degree distribution, with the degree (number of connections of a node) (x axis) plotted against the proportion of nodes in that degree (y axis). Arrow: the PARP1 node. The fitted probability density function of the degree distribution is proportional to k−1076, where k is the degree. (C) The number of genes (x axis) of each GO term (dot) vs. the enrichment level of this GO term in PROPER v.1.0 (y axis). Color of the dots: the GO terms with less (green) and more (yellow) than 300 genes. (D) The translation subnetwork. (E) The RNA splicing subnetwork, including the core components of human spliceosomes (U snRNP), components of the pre-spliceosome complex, the precatalytic spliceosome and catalytic step 1 spliceosome (Complex A/B/C), the exon junction complex (EJC), and the transcription and export complex (TREX), as well as SR proteins, Sm proteins, heterogeneous nuclear ribonucleoproteins (hnRNP) and pre-mRNA processing factors (Prp). Pink edges: known PPIs (as documented in APID database). Grey edges: previously uncharacterized PPIs.
