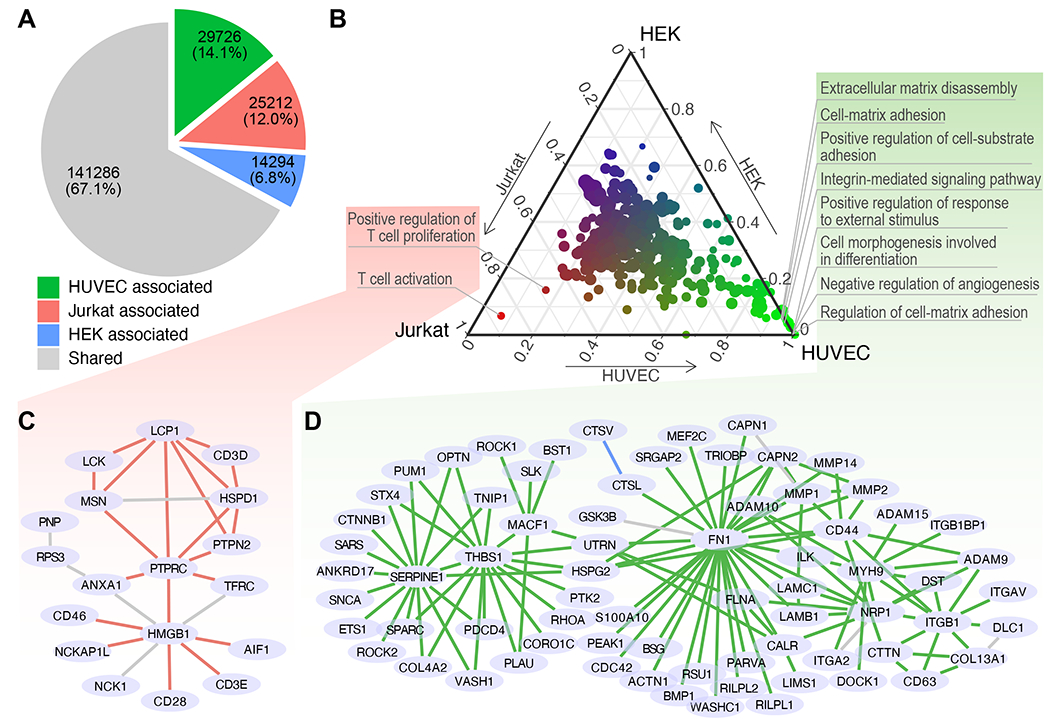
Figure 6.

Cell type-associated subnetworks. (A) Numbers of PPIs associated with HEK, Jurkat, HUVEC and those that did not associate with any cell type (shared). (B) Associations of subnetworks and cell types. The proportion of PPIs that are associated with each cell type (each axis on the edge of the triangle) in every GO term-defined subnetwork (dot). The relative associations to the three cell types are also represented in a color gradient from red (Jurkat) to green (HUVEC) and to blue (HEK). Dot size: the number of genes in a GO term. (C-D) Expanded view of the combined subnetwork of the subnetworks associated with Jurkat (C) and those associated with HUVEC (D). Edge colors denote shared PPIs (grey) as well as the PPIs associated with Jurkat (red) or HUVEC (green).
