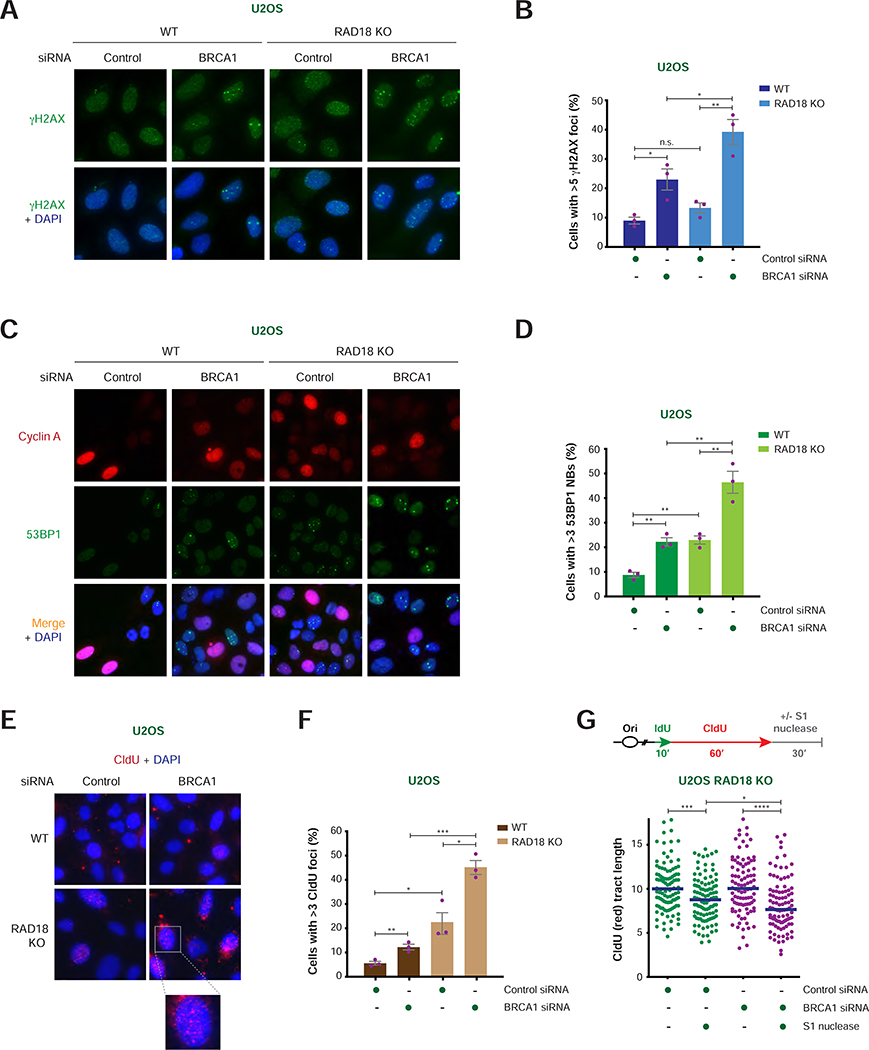
FIGURE 2. Analysis of DNA damage induced by RAD18 loss in BRCA1/2-deficient cells.
A) Representative images of γH2AX foci (green) with and without DAPI staining (blue) in WT and RAD18 KO U2OS cells after treatment with the indicated siRNAs. Scale bar = 10 μm.
B) Percentage of cyclin A-positive cells with >5 γH2AX foci per nucleus in WT and RAD18 KO U2OS cells treated with the indicated siRNAs. Values of individual experiments are indicated as dots. Columns represent the mean ± SEM of independent biological replicates (n = 3). Statistical analysis was conducted by unpaired t-test (*p < 0.05, **p < 0.01, ***p < 0.001).
C) Representative images of cyclin A (red) and 53BP1 (green) staining with and without merge with DAPI staining (blue) in WT and RAD18 KO U2OS cells after treatment with the indicated siRNAs. Scale bar = 10 μm.
D) Percentage of cyclin A-negative cells with >3 53BP1 nuclear bodies (NBs) per nucleus in WT and RAD18 KO U2OS cells treated with the indicated siRNAs. Graphical representation and statistical analysis were conducted as in (B).
E) Representative images of CldU staining under non-denaturing conditions (red) with DAPI staining (blue) in WT and RAD18 KO U2OS cells after treatment with the indicated siRNAs. Scale bar = 10 μm.
F) Percentage of cyclin A-positive cells with >3 CldU foci per nucleus in WT and RAD18 KO U2OS cells treated with the indicated siRNAs. Graphical representation and statistical analysis were conducted as in (B).
G) Schematic of the IdU/CldU pulse-labeling protocol followed by S1 nuclease treatment (top). Dot plot and median of CldU tract lengths (μm) in RAD18 KO cells per indicated experimental condition (bottom). P-values were calculated by Mann-Whitney test (*p < 0.05, ***p < 0.001, ****p < 0.0001).

