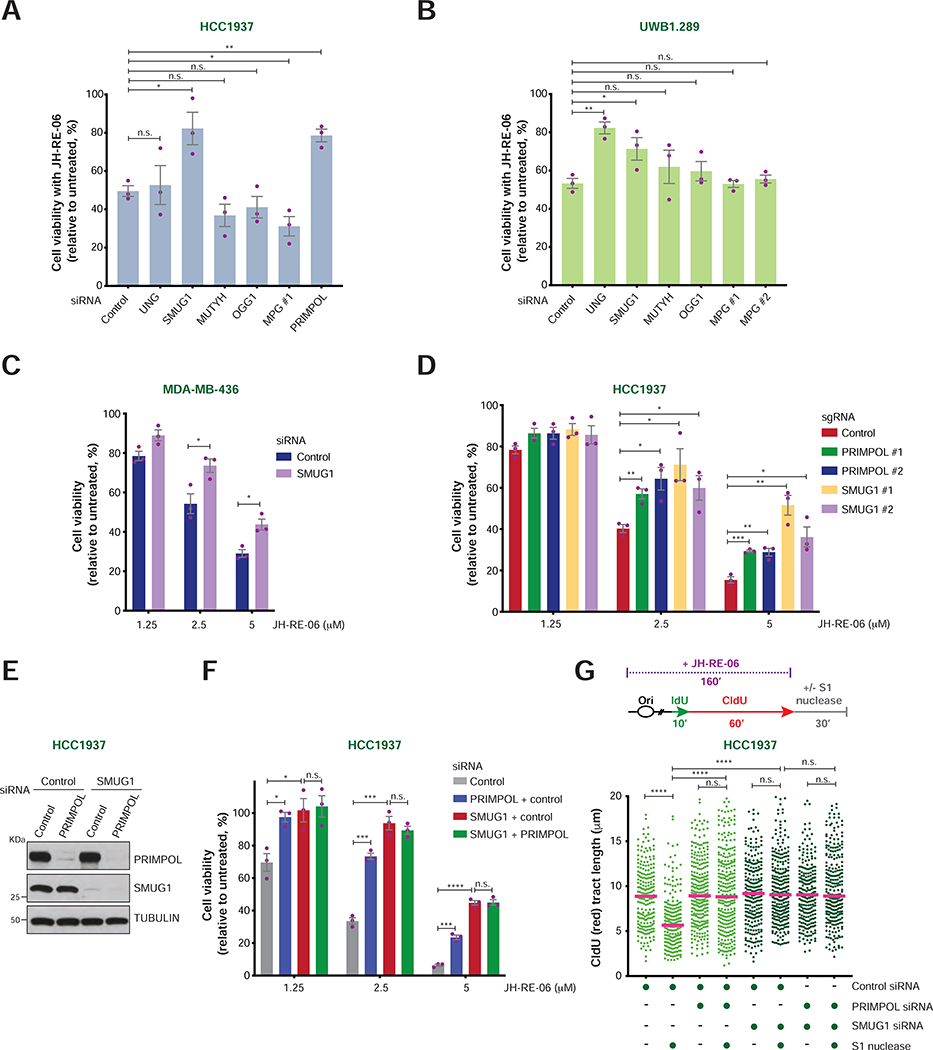
FIGURE 6. Cellular viability and ssDNA gap formation upon loss of SMUG1 and/or PRIMPOL in BRCA1-mutant cancer cells.
A-B) Viability of HCC1937 (A) and UWB1.289 (B) cells treated with the indicated siRNAs and JH-RE-06 (2.5 μM and 1.5 μM, respectively). Cell viability is expressed as percentage relative to the untreated control. Values of individual experiments are indicated as dots. Columns represent the mean ± SEM of independent biological replicates (n = 3). Statistical analysis was conducted by unpaired t-test (*p < 0.05, **p < 0.01, ***p < 0.001, ****p < 0.0001).
C) Viability of MDA-MB-436 cells treated with control and SMUG1 siRNAs at the indicated JH-RE-06 doses. Graphical representation and statistical analyses were conducted as in (A) and (B).
D) Viability of HCC1937 cells treated with control, SMUG1 and PRIMPOL sgRNAs at the indicated JH-RE-06 doses. Graphical representation and statistical analyses were conducted as in (A) and (B).
E) PRIMPOL and SMUG1 levels in HCC1937 following transfection of the indicated siRNAs, as detected by western blot. Tubulin is shown as control.
F) Viability of HCC1937 cells following treatment with the indicated siRNAs and doses of JH-RE-06. Graphical representation and statistical analysis were conducted as in (A) and (B).
G) Schematic of the IdU/CldU pulse-labeling protocol with JH-RE-06 treatment followed by S1 nuclease digestion (top). Dot plot and median of CldU tract lengths (μm) in HCC1937 cells subjected to the indicated experimental conditions (bottom). P-values were calculated by Mann-Whitney test (****p < 0.0001).

