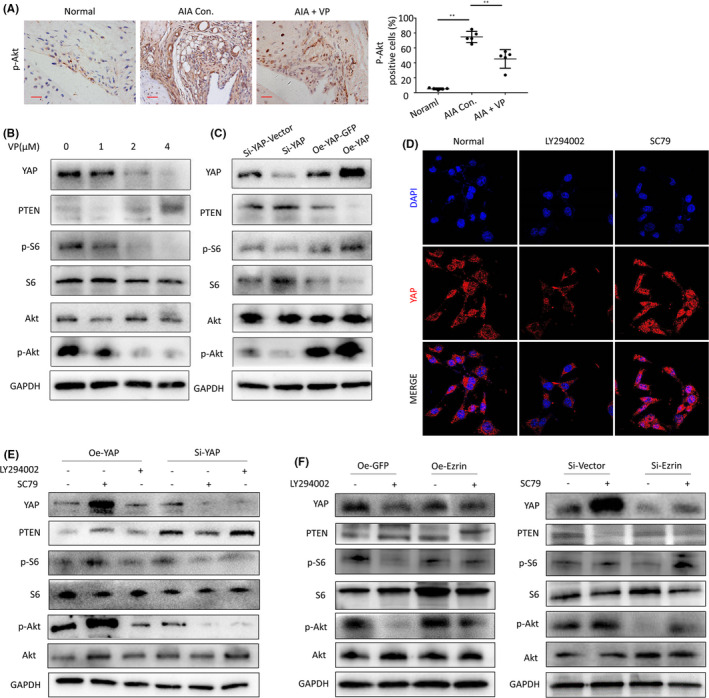
FIGURE 6.

(A) p‐Akt protein levels in the IHC analysis and positive cells of the knee joints from treated AIA mice (Scale bar, 25 μm). (B) The Western blot results showed that the verteporfin treatment inhibited the protein expression of PI3K/Akt in HUVECs. (C) The Western blot was used to measure YAP protein in HUVECs following transfection and silencing of YAP and the protein expression of PI3K/Akt. (D) Representative images of YAP nuclear translocation affected by PI3K/Akt signalling pathway. (E) Western blot results showed that there was interaction between hippo‐YAP expression and PI3K/Akt signalling pathway. (F) Western blot results showed that there was interaction between Ezrin expression and PI3K/Akt signalling pathway
